
10 Higher scale considerations
The urban context and beyond
When analysing building performance at the design stage using modelling and simulation techniques, buildings have historically been assumed to exist in an isolated state – essentially on flat unobstructed terrain, but with access to inexhaustible utility networks. In the vast majority of cases, this is a gross simplification. Consider the following diagram, which identifies the principle systems and some of the primary interconnections between them that influence the flows of (predominantly urban) resources.
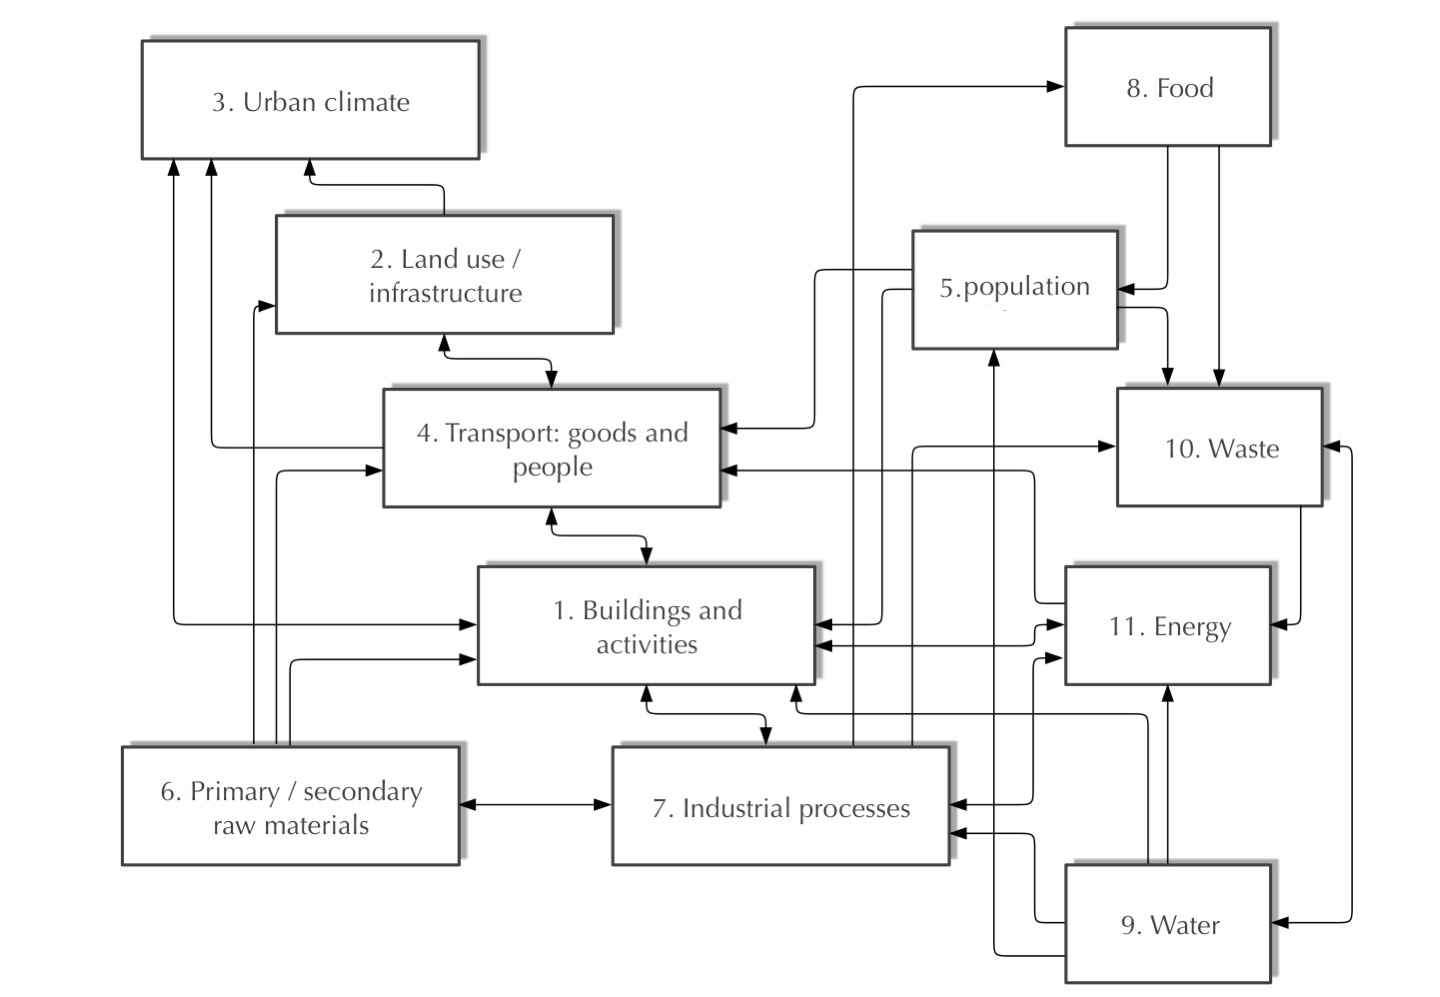
Let us begin with [1] Building and Activities, which refers to the physical composition of the building and its HVAC and lighting systems, the activities of the occupants accommodated within it and their corresponding ownership and use of electrical appliances in support of their activities. Clearly, these buildings are located on [2] parcels of land which are themselves interconnected and serviced by transport and utility infrastructure. Whether developed upon or not, these parcels of land have their own surface properties: they may be partially or fully vegetated, or conversely partially or fully impervious with corresponding implications for evaporative mass and latent heat fluxes and for the conduction and storage of heat within the ground. They may accommodate buildings of varying horizontal and vertical massing, with corresponding implications for albedo (of which more later) and thus for shortwave and longwave radiation exchange. These surface fluxes influence [3] the urban climate; as does the rejection of heat from buildings’ HVAC systems, which is in turn influenced by the urban climate. Goods and people are also [4] transported, using transport infrastructure, between the parcels of land on which our buildings are located, with corresponding heat gains influencing the urban climate. Whether they are homes, workplaces, retail outlets or accommodate health, education, leisure or service facilities, these buildings temporarily accommodate a population of people [5]; as do the vehicles used to transport people between these buildings. Our infrastructure, buildings and their fixtures and fittings and transport vehicles are constructed from [6] materials, components and products that entail unique lifecycle impacts and that have properties impacting upon their performance; some of which may be fabricated using [7] industrial processes accommodated within buildings. Foods [8] may also be produced within similar industrial premises, some of which will be consumed by members of our population, which also consume [9] water; as do some of our building activities. Waste [10] from this food and water consumption, as well as from industrial and construction processes, requires treatment, and these treatment processes may lead to usable waste heat (thermal energy). Finally, our buildings and associated activities, industrial processes and transport vehicles use [11] thermal and electrical energy. This may be centrally generated (or recovered) and distributed to our city, or locally recovered and/or converted and distributed.
In this chapter, we reveal the nature and complexity of those interactions that have a particularly significant impact on Carbon emissions and/or the comfort of occupants and pedestrians. In particular, we focus on:
- The impacts of local obstruction on radiation exchange.
- The urban thermal climate, the urban heat island and pedestrian comfort.
- Interactions between buildings and local vehicular and utility infrastructure.
- The context of the wider national infrastructure (particularly the power sector).
- Stocks of buildings, their Carbon impacts and decarbonisation policy.
The chapter closes with a brief discussion of some interesting emerging trends and the opportunities to reduce Carbon impacts that may be afforded by them.
10.1 Buildings and their local climate
It is somewhat rare for a building to be situated on flat isolated terrain. Even agricultural buildings tend to be colocated. In 2007 the urban fraction of the global population exceeded the rural for the first time, following a prolonged period of rural-urban migration. By 2050, according to medium fertility forecasts (United Nations, 2014), two-thirds of the global population is expected to live in cities, with much of the remainder living in towns and villages. Buildings then are very commonly located in close proximity to other buildings. But they may also be located close to trees or within sight of hills and mountains. These physical objects (buildings, trees, hills, mountains…) obstruct views of the sun and the sky, but they also reflect light and solar radiation. Building and trees we tend to consider as near-field obstructions and hills and mountains as far-field obstructions. [1]
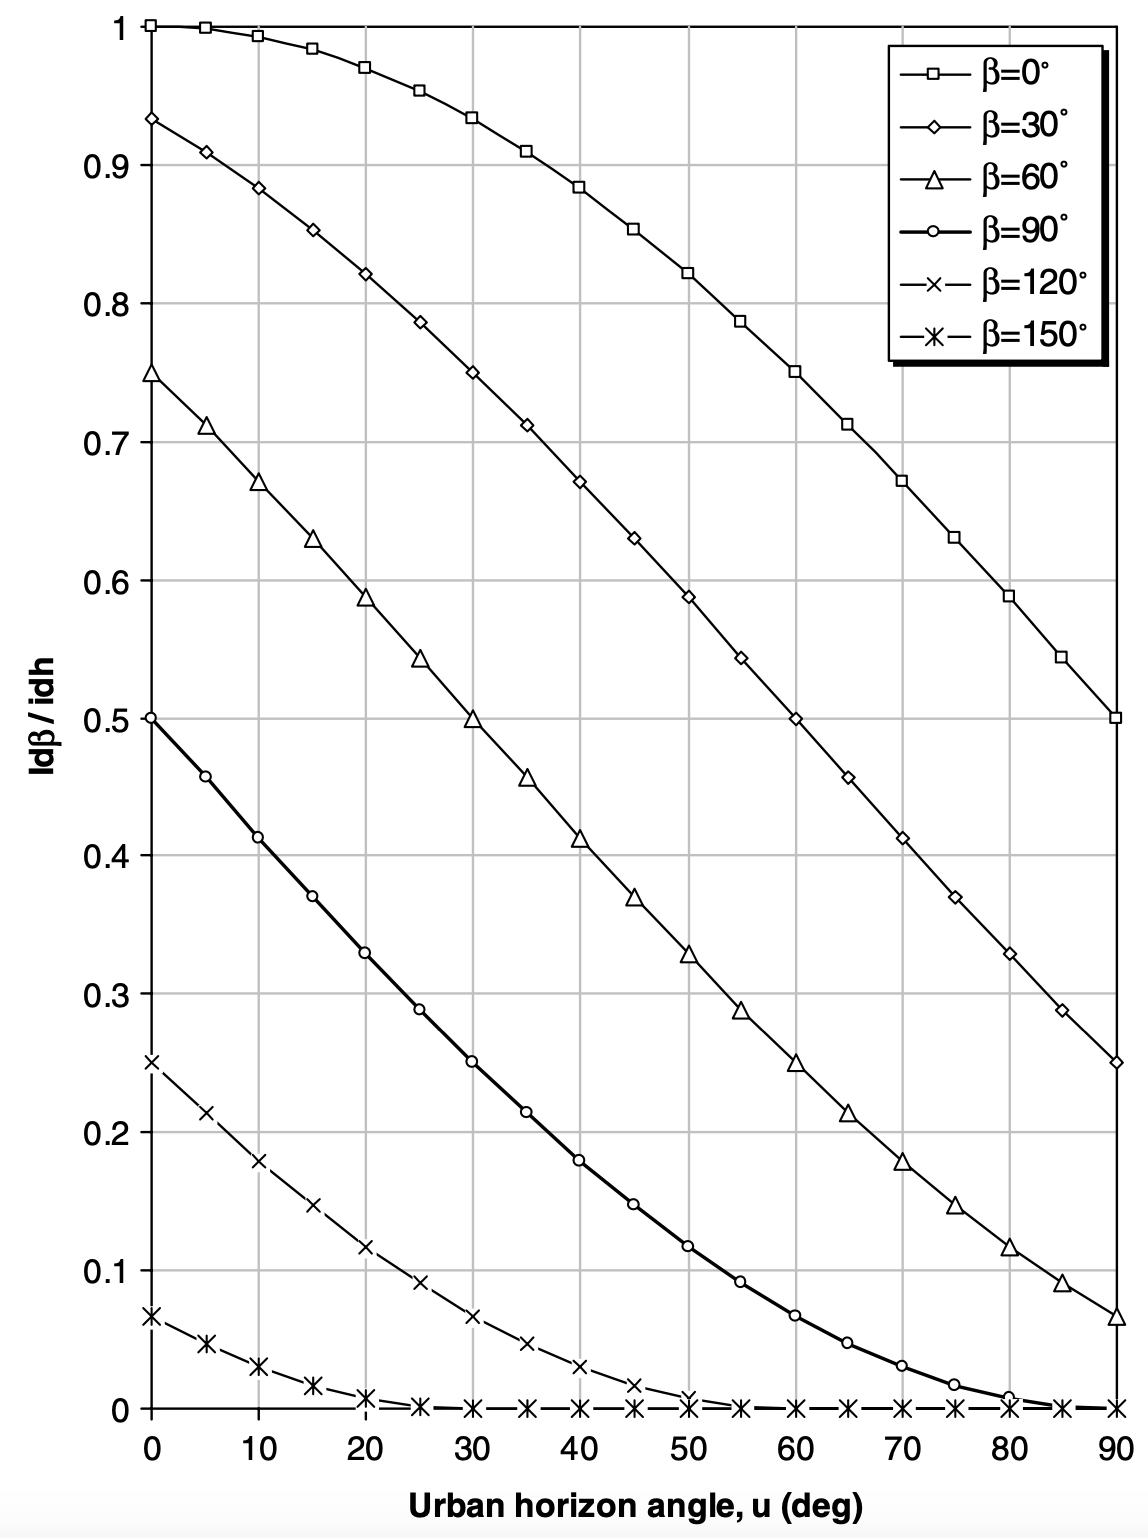
To shed light on these relationships, it is helpful to re-introduce[2] the urban horizon angle (UHA). This is the average angle, above the horizontal plane, that is subtended from obstructions that are adjacent to a point on a (usually vertical, so with a surface slope  of 90o) building facade. As such, a UHA of 10o relates to an adjacent urban skyline that is 10o above the horizontal, as viewed from say the mid-point of a window. The chart below expresses the reduction in available solar radiation from the sky, relative to that on an unobstructed horizontal plane, for surfaces of different slope. Since this is based on an isotropic sky (so, one in which the sky has the same brightness in all directions), the value on the y-axis should be double for a vertical surface (of slope 90o) to transform this into a reduction relative to that incident on a vertical surface. As such, if our receiving vertical surface is faced with a UHA of 50o, this leads to a value of just under 0.2: the obstructed surface received less than 20% of the diffuse (or sky) radiation of an equivalent unobstructed surface.
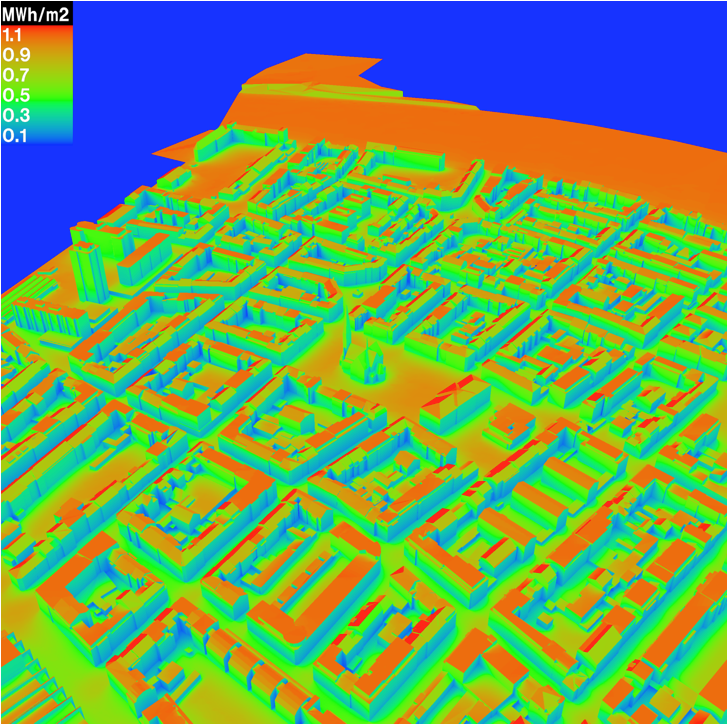
This of course does not tell the whole story. Adjacent objects also obstruct (we usually refer to this as an occlusion) views of the sun, as well as contribute reflected daylight and solar radiation. Modelling these processes analytically is complex, particularly when the sky is anisotropic, as it invariable is in reality. To account for these complex phenomena in an accurate manner, we tend to make use of radiosity or ray-tracing simulation engines (as described in Chapter 6). Shown below is an example of a 3D model of the centre of Basel (Switzerland) in which each pixel representing a surface is false-coloured according to the total annual solar irradiation that is incident at that position, accounting for all contributions from the sun, the sky and reflecting surfaces. From this, we can see that many of the building facades experience gradients of solar irradiation availability, typically with a minima at the base and a maxima at the apex.
Consider now a hypothetical case in which all of the surfaces from which the above 3D model is comprised have an identical reflectance, say 0.2. If this were beside another scene covering a similar spatial extent, but this scene was completely flat, and if this other scene had exactly the same 0.2 reflectance, would that flat scene absorb the same amount of solar energy as the real three-dimensionally complex scene of Basel? The answer is no, it would absorb less. That’s because it has a higher albedo: the ratio of the outgoing radiation to the incoming radiation. Our flat scene would have an albedo equal to the reflectance, 0.2, but our real scene would have a lower albedo. That is because many of the surfaces receiving solar radiation from the sun and sky, reflect some of this radiation to the adjacent surfaces that are visible to them, which in turn reflect some of the energy incident upon them, back. These successive inter-reflections increase the overall amount of solar radiation that is absorbed within our urban scene, so reducing its effective albedo.
In a similar way, our 3D surface texture also occludes views of the sky at night. This has the effect of reducing longwave (or infrared) radiation exchange from relatively warm urban surfaces to the cold night sky. The result of these two processes is that urban areas absorb more shortwave (solar) radiation and emit less longwave (infrared) radiation than their flat rural equivalents. In addition to this net increase in absorbed energy, anthropogenic activities – transport, industrial activities, the heating and cooling of buildings etc – also contribute a heat gain. Urban areas also tend to be less vegetated than their rural equivalents, so they also experience less evaporative cooling; further increasing the net relative heat gain. All of this means that urban locations are typically warmer than adjacent rural locations. We call this phenomenon the urban heat island, or UHI, the magnitude (or intensity) of which is expressed as the difference in temperature between the urban and adjacent rural locations: ΔTUHI = Turban – Trural.
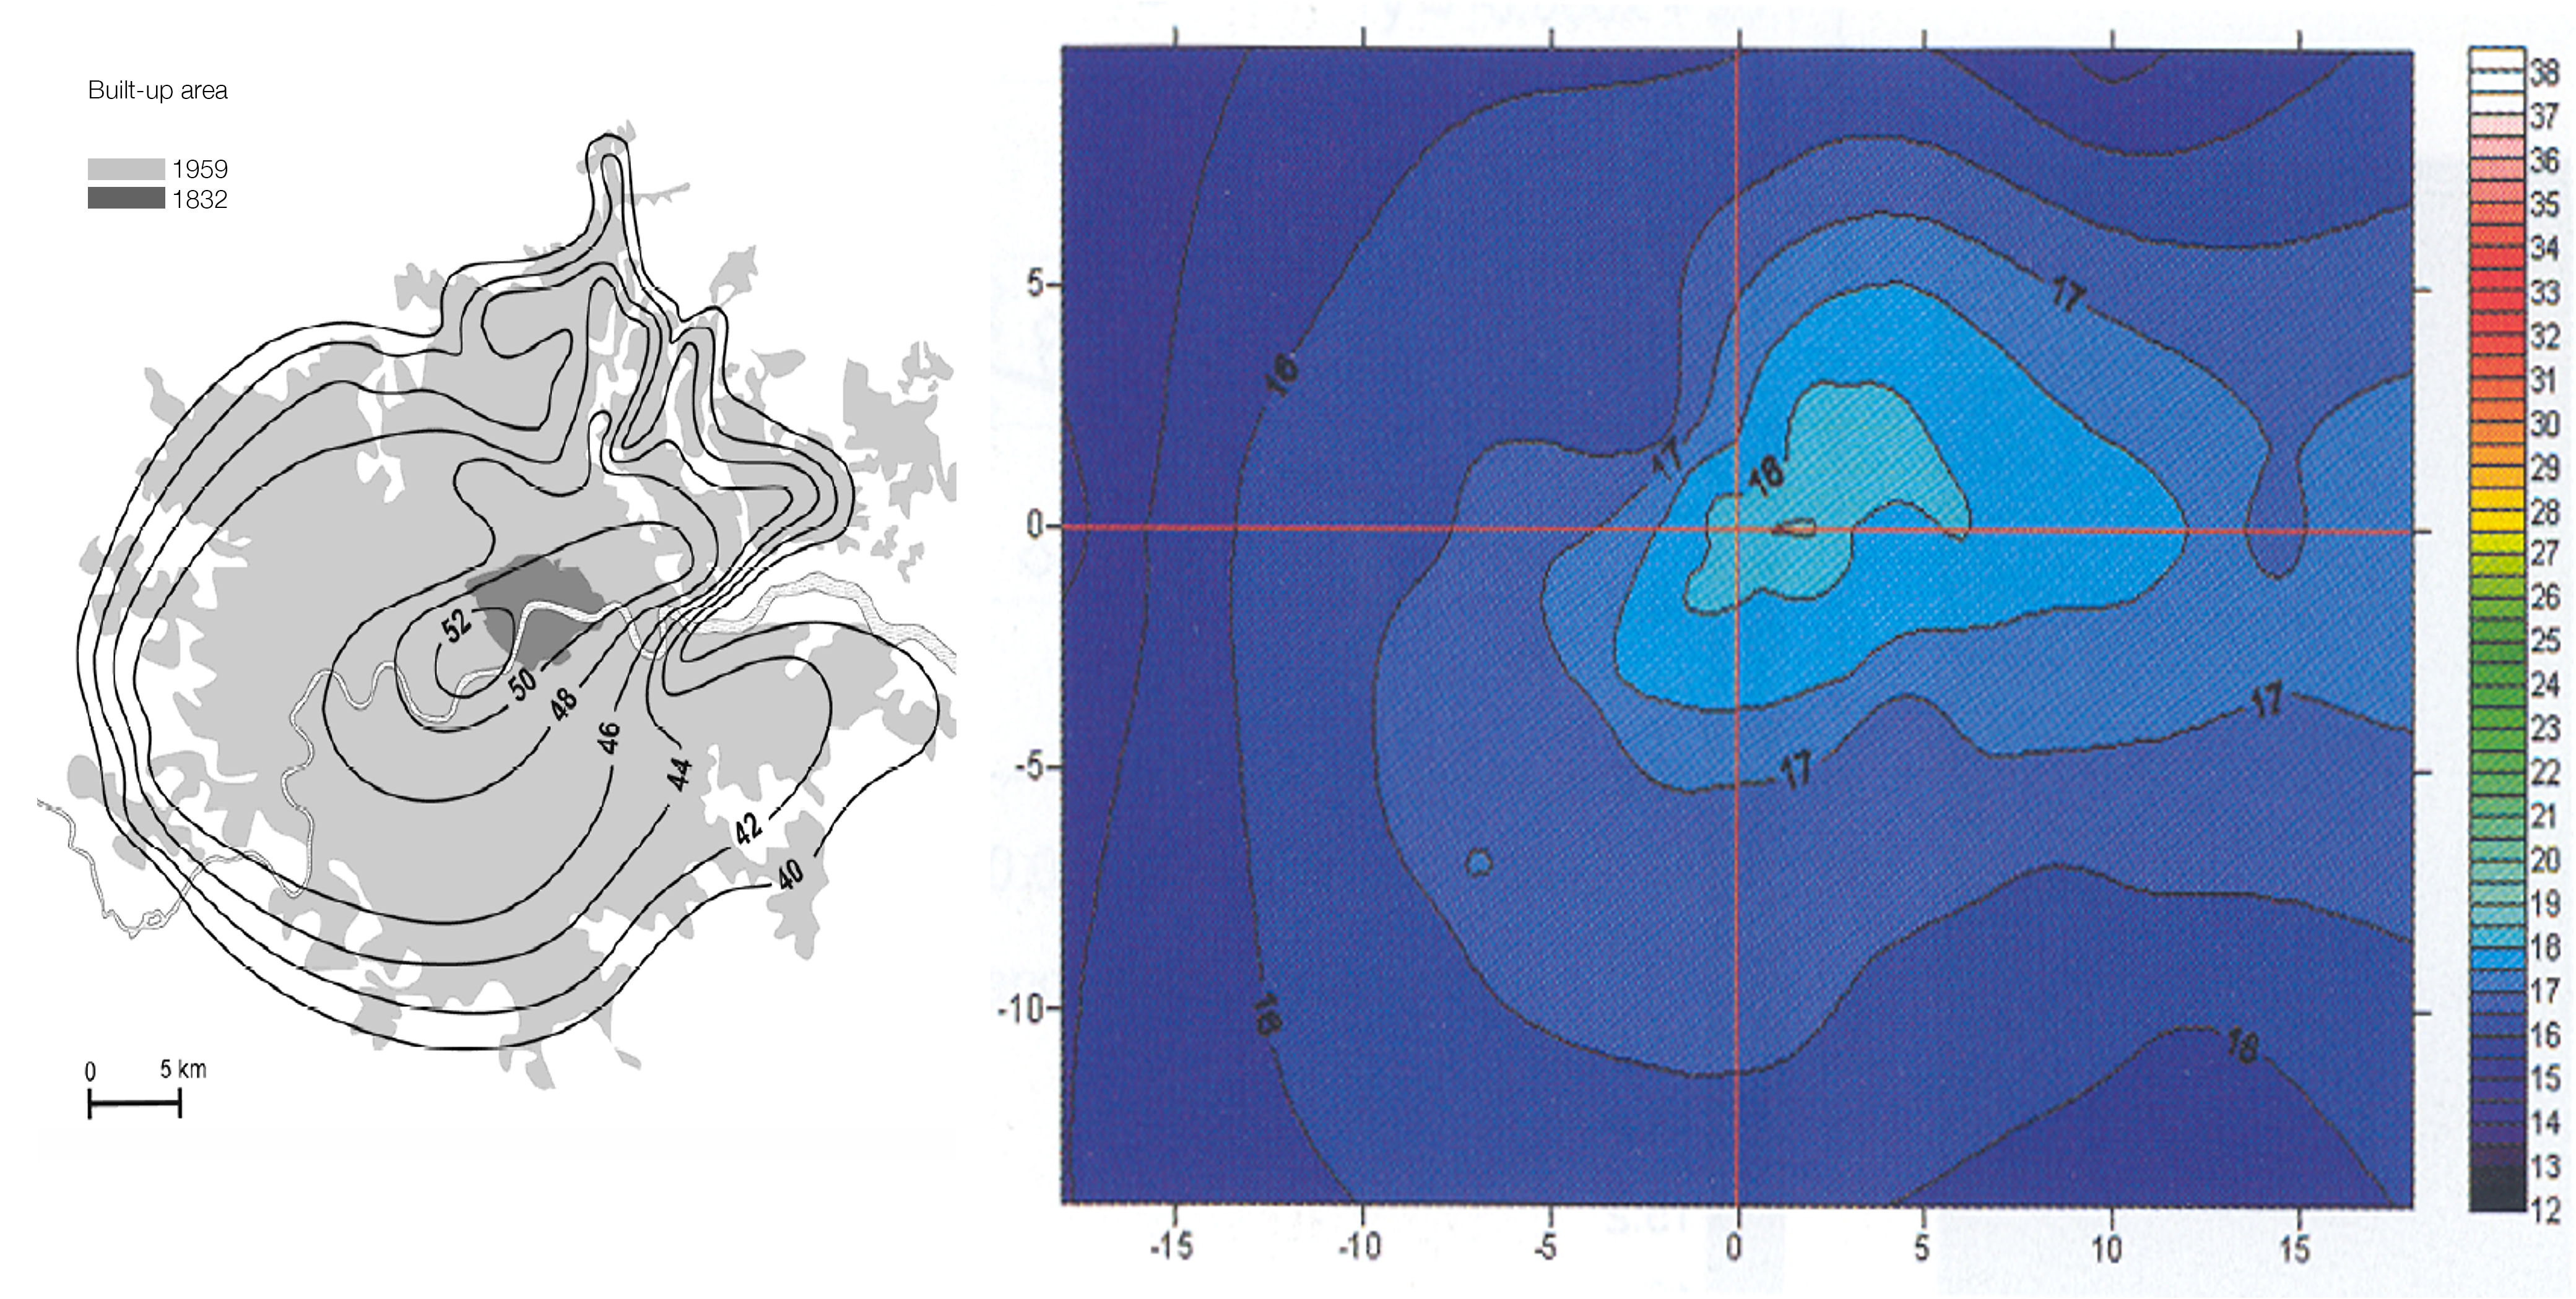
At the scale of the city, its warmer-than-average surfaces convect heat to the air, effectively creating a buoyant plume of heat, with cool air being entrained at the perimeter and warm air rising vertically about its centroid. As such, the UHI intensity tends towards a maximum at the centre of the city, as the buoyant plume (which may be both deflected and diluted by wind) is progressively heated. This type of behaviour has been observed in numerous experimental field studies. See for example the spatial UHI images below.
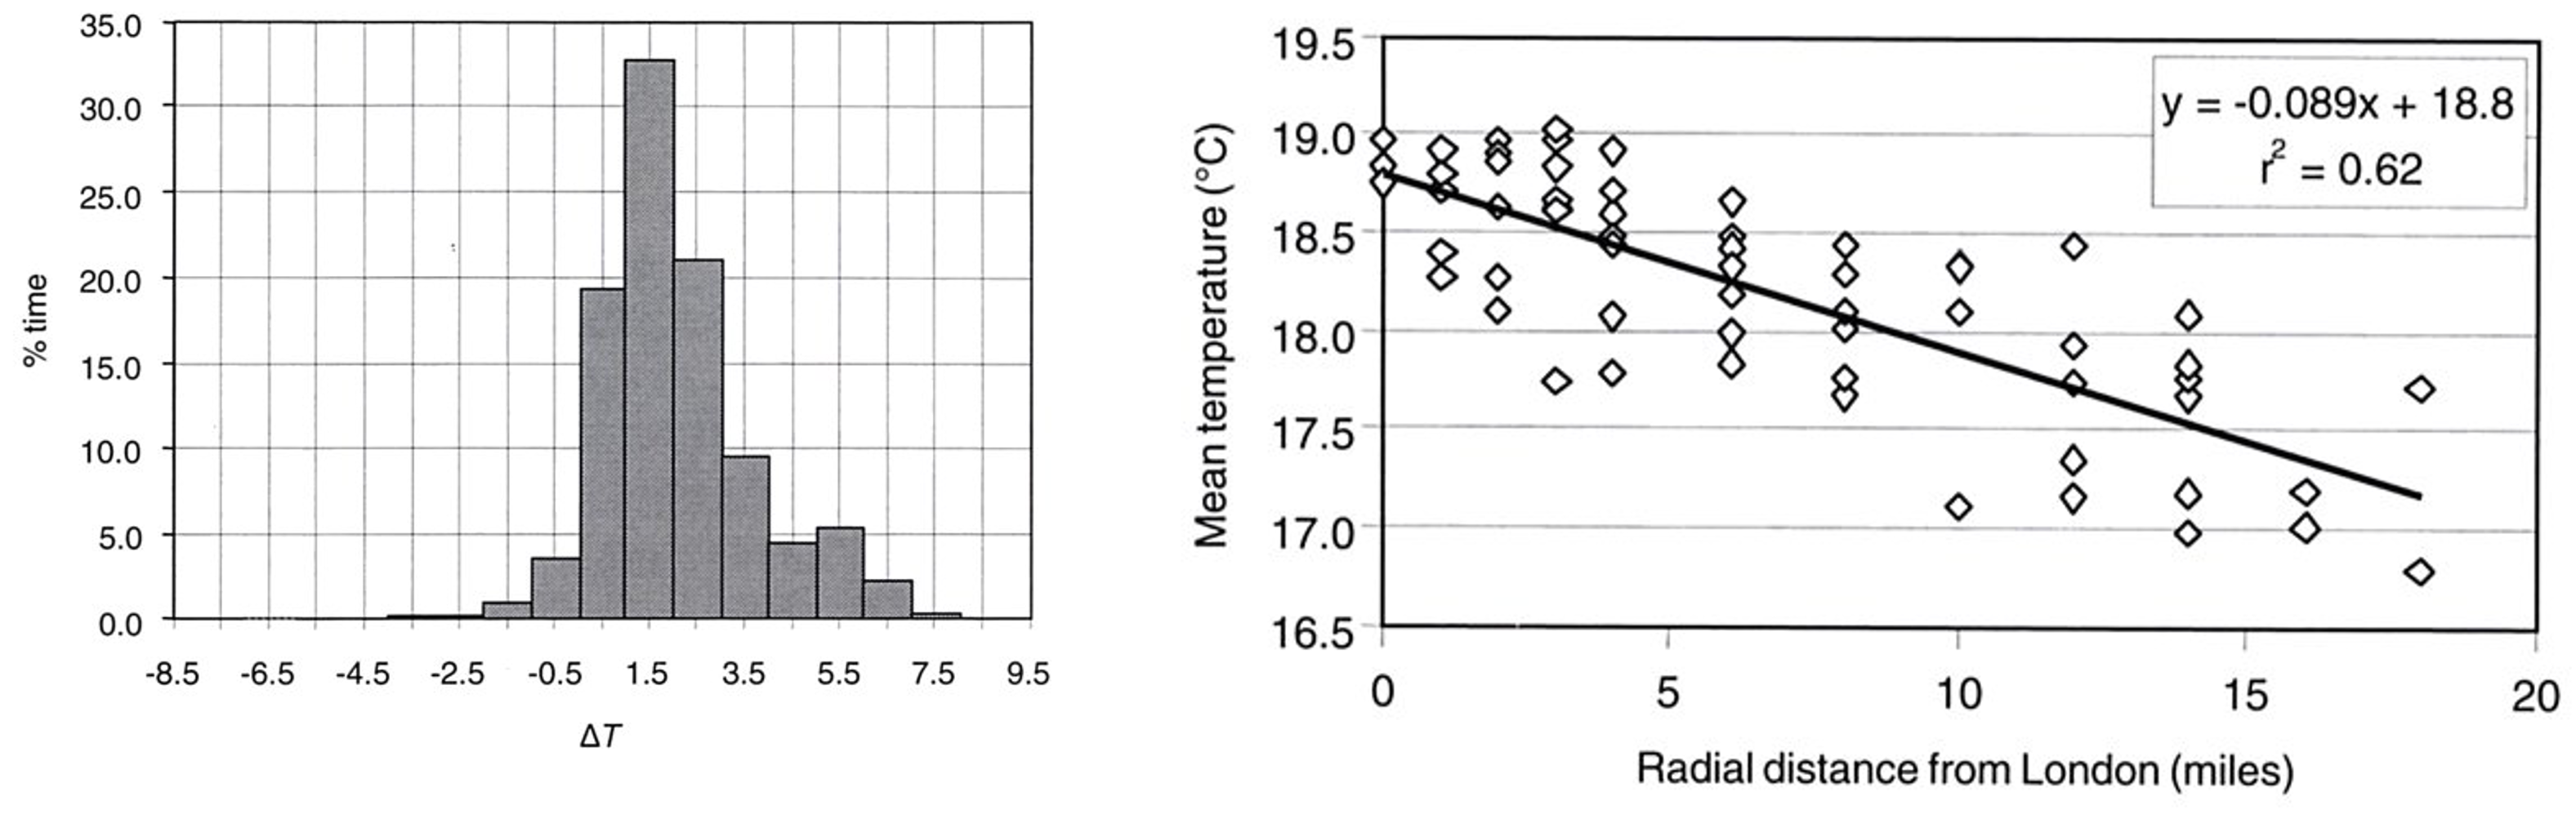
Shown below are two further charts relating to London’s UHI. The first (left) is a frequency distribution of ΔTUHI, which demonstrates that the UHI is overwhelmingly positive, but that there are occasions when it is negative. This is because the urban surfaces are comprised of materials that have a higher heat capacity than rural surfaces (which are comprised mainly of soil and vegetation), which means that the rise in temperature of the higher capacity urban surfaces lags behind that of the rural, so that rural surfaces become warmer, quicker and our ΔTUHI is negative in the afternoon. The chart to the right simply underscores the fact that the UHI progressively increases from the periphery en-route towards the centre of the city.
The UHI is not a new phenomenon. Indeed, it appears to have been discovered by Howard, as long ago as 1833. Howard noted that “The excess of the temperature of the city varies throughout the year, being lest in spring and greatest in winter; and it belongs in strictness to the nights; which average three degrees and seven-tenths warmer than in the country…while the heat of the day, falls, on a mean of years, about a third of a degree short of that in the open plane”. This confirms what was observed above, that the maximum heat island occurs during the night, the minimum during the daytime; and this may indeed be negative. The fact that the UHI appears greatest in winter may relate to the fact that anthropogenic heat gains are higher and the solar altitude is lower, which serves to increase the amount of energy that is absorbed by vertical surfaces, whether directly or following inter-reflection.
The UHI is considered to be a city-scale phenomenon, and it is one that exacerbates the effects of heat waves. When a heat wave is experienced, the UHI is essentially superimposed, further increasing the severity of the heat wave: both its magnitude and its duration, with adverse consequences for human mortality. Indeed, it is estimated by the Office for National Statistics, that there were over 2,300 excess mortalities associated with excess heat in the summer of 2006 (ONS, 2021).
We can refer to the UHI as a kind of background mesoscale phenomenon. Superimposed onto this is a kind of foreground micro-scale phenomenon, due to the local microclimate. This latter occurs at the local scale of the street canyon (or similar). It is at this scale that the effects of anthropogenic heat gains, for example from vehicles or air-conditioning units from buildings, as well as shading and evaporative cooling from trees, the shading provided by the geometry of buildings which form the canyon, and how this in turn influences the local wind conditions, are locally experienced. As implied above, these local energy exchanges locally increase or reduce the air (and radiant) temperature.
The combined influences of the UHI and local microclimatic energy exchanges have an impact on the energy demand of buildings. In the heating-dominated climate of the UK, these influences serve to reduce the demand for heating and the associated Carbon impacts. However, this also has an adverse impact on summertime thermal comfort, overheating risk and mortality of occupants of buildings. This also, of course, impacts on the thermal comfort of pedestrians.
Outdoor thermal comfort metrics
According to Kumar and Sharma (2020), the four most commonly employed metrics for outdoor comfort assessment are the Physiologically Equivalent Temperature (PET), the Universal Thermal Comfort Index (UTCI), the Predicted Mean Vote (PMV) and the Standard Effective Temperature (SET), in descending order of prevalence. The PMV model, which was described in Chapter 3, is not strictly applicable to outdoor settings as it is a steady-state model (in our outdoor context that is far from steady state) and has no basis for explicitly considering the effects of solar radiation on the human heat balance. PMV has been found to consistently overestimate thermal sensation (and thus the mean vote) when applied to outdoor spaces.
PET uses the two-node Munich Energy balance Model for Individuals (MEMI), whereas SET (and an outdoor version OUT-SET) uses the two-node model of Gagge that was presented in Chapter 3 and the UTCI uses the multi-node model of Fiala, also briefly presented in Chapter 3. These are all equivalent temperature models, in which the equivalent temperature corresponds to the air temperature of a typical indoor room that generates the same physiological responses (skin and core temperature, skin wettedness) as would the actual complex conditions experienced by the subject (Lai et al, 2020). The UTCI was developed by the International Society of Biometeorology, with the consensus of its multidisciplinary expert members. It is arguably the most rigorous of the outdoor comfort metrics and is equal to the air temperature plus an offset, which is a function of air temperature, mean radiant temperature (including solar effects), air speed and water vapour pressure.
10.2 Buildings and infrastructure
In addition to the historical assumption that buildings are situated on flat isolated terrain, it has also historically been assumed that they are connected to national utility grids with an inexhaustible supply of (energy and water) resource. Increasingly, however, buildings have renewable energy resources embedded within them, or have access to local energy conversion infrastructure. This is particularly the case for rural communities in the Global South which are too remote for connection to centralised utility networks to be economically viable, particularly in Asia (e.g. India, Myanmar, Pakistan) and Africa (e.g. Democratic Republic of Congo, Nigeria, Tanzania), where micro- and mini- grids are increasingly commonplace. These local grids primarily make use of PV panels and batteries to store the electrical energy, sometimes supplemented with diesel or biofuel generators for periods in which the stored energy has been exhausted. In some cases, particularly in India, these local grids are also connected to the national grid. The value here lies in the use of local renewables to offset the demand from predominantly fossil fuel-based power stations and the associated transmission losses through the distribution networks.
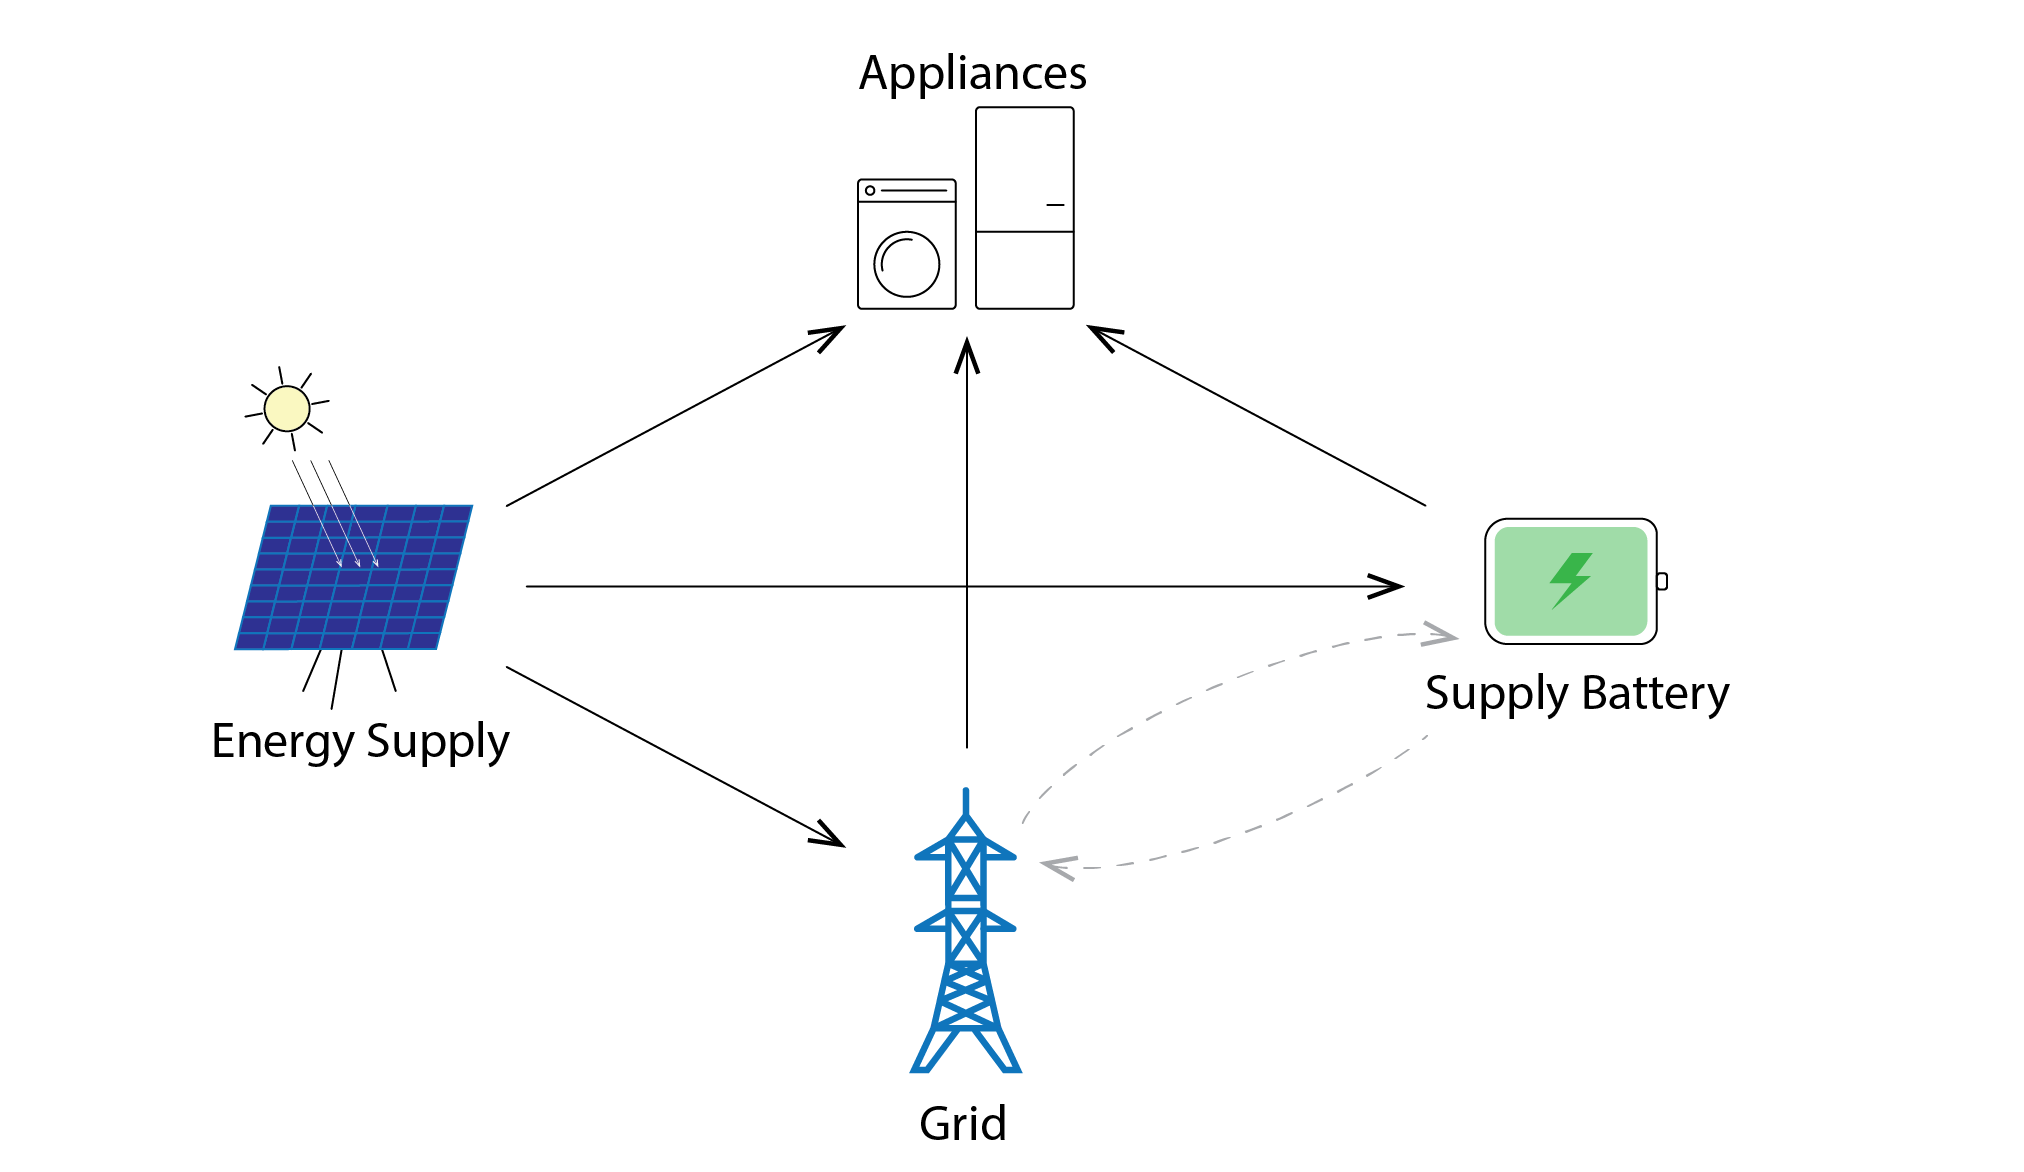
The growth in the ownership of electric vehicles (EVs) provides the opportunity for valuable distributed electrical energy storage. Local renewable energy technologies may store excess electrical energy in these batteries, charging them for subsequent journeys, but also potentially later providing some fraction of this stored energy to service electrical energy appliances in the buildings that their chargers are connected to. In a home context, this could mean that PV panels charge the EV, which can subsequently power lights, TVs and other appliances during sundown. Furthermore, demand-response technologies can control the dispatch of this stored energy and the appliances that may be served from it. These flows are conceptually illustrated below (Figure 6).
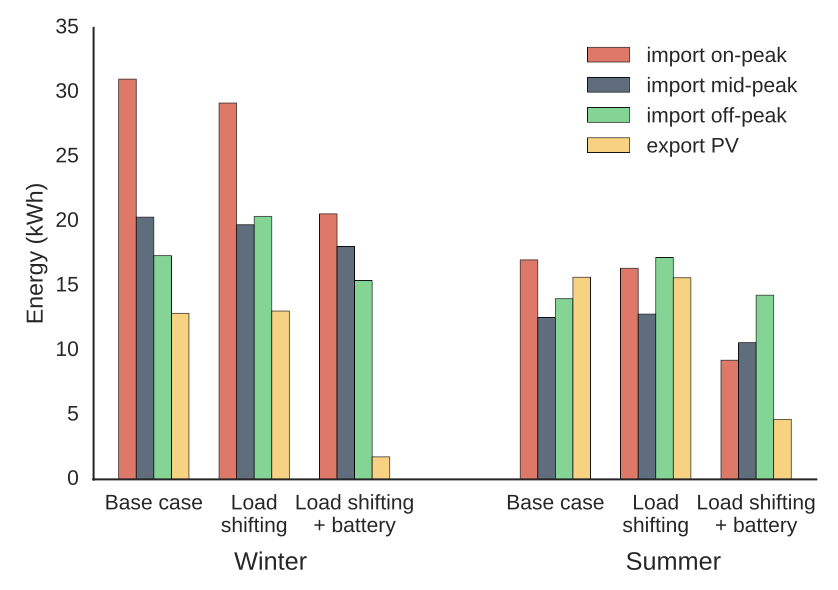
Shown below (Figure 7) is a chart illustrating the amount of energy imported during three different tariff periods as well as the energy exported during periods of surplus for three scenarios: a) a base case of no demand-response technology, b) using demand-response technology to shift appliance usage to maximise autonomy based on energy pricing signals, and c) the same as ‘b’ but now also using on-site batteries. In both Summer and Winter, this latter scenario minimises exports to the national power grid to maximise local energy autonomy and thus minimise net Carbon emissions.
As noted in Chapter 1, the UK government (and many other governments internationally) is promoting the electrification of heating, since energy use for space heating and domestic hot water accounts for around 80% of domestic energy use, and this is overwhelmingly based on gas-fired boilers feeding hot water to a central heating system and a hot water storage tank. The government aims to substitute these systems for air-source, and to some extent ground-source, heat pumps. At present, the UK power sector relies mainly on traditional power stations which convert chemical energy from coal and gas into electrical energy; the remainder being provided primarily from nuclear and renewable energy technologies. For the UK government to achieve its long-term commitment to achieve Carbon neutrality, this power sector needs to be decarbonised. This is expected to be achieved through increased investments in renewable and nuclear energy technologies, increased energy storage infrastructure and improved control of both the grid and of end-use electrical appliances. Only then will the electrification of heating become Carbon neutral.
10.3 Building stocks and decarbonisation policy
The housing sector was estimated to be responsible for some 30% of greenhouse gas emissions in 2019. More than four-fifths of UK homes are currently still heated by gas boilers, a much higher proportion than in most countries. The UK’s housing stock is also the oldest and least energy efficient in Europe. Over 52% of homes in England were built before 1965 and nearly 20% were built before 1919. According to the Office for National Statistics, some 58% and 63% of dwellings in England and Wales have an energy performance certificate rating of D or lower.
There is an urgent need to improve standards of energy conservation and energy efficiency in the UK housing stock – improving standards of insulation and draught proofing and substituting heating systems in tandem with the decarbonisation of the power sector. This is an enormous challenge, and policy measures to date have consistently failed to achieve the scale of transformation that is needed (Hodgkin and Sasse, 2022).
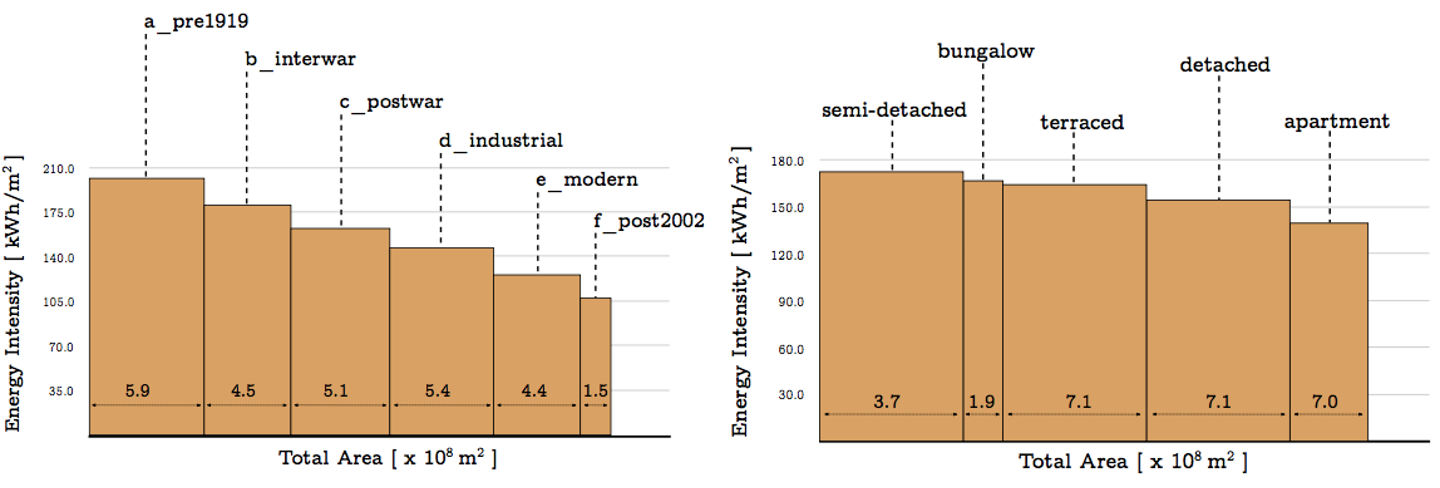
Policy interventions are needed that incentivise large-scale renovations to both the fabric and systems of buildings, but these need to be suitably targeted. Housing Stock Energy Models (HSEMs) can provide valuable support in this endeavour. These models represent national housing stocks through the use of archetypes, distinguishing between the form of the building (e.g. detached, semi-detached, terraced, flat) and categories of age, which largely determines the mode of construction employed and corresponding standards of insulation (e.g. solid wall, cavity wall etc). Weights are then employed to enable the energy use from these archetypes to be extrapolated to the national scale. HSEM modelling strategies are described by Sousa et al (2017) and Robinson et al (2023). In the UK, the most sophisticated HSEM is the dynamic housing stock energy hub (EnHub) platform, developed by Sousa et al (2018). This represents the UK housing stock through a synthetic stock of 1016 archetypes, facilitating detailed representations of the structure and emissions by type and age of the house, as in the charts below (Figure 8). The first of these presents a histogram of energy use intensity, in which the area of each element corresponds to the total energy use (EUI on the y-axis, multiplied by the total floor area on the x-axis).
The second of these charts, below (Figure 9), depicts the frequency distribution (the number of homes: y-axis) of total annual energy use per home (x-axis) for homes constructed pre- and post- 1920 respectively. This represents homes as they were at the time of the survey of the housing stock (base) and the outcome from perfect (A-all) and partial (B-all) penetration of a raft of measures to improve their energy performance.
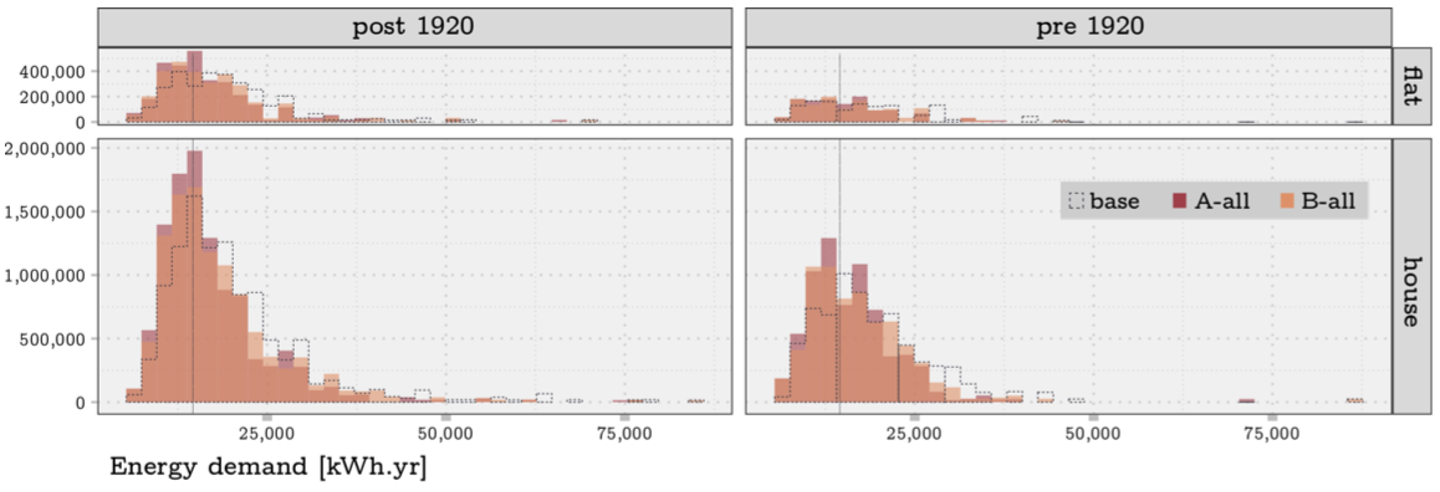
EnHub represents the characteristics of the envelope, systems and occupancy of its archetypes, using survey data arising from the English Housing Survey (EHS). This is a continuous survey that is published annually and typically involves around 13,300 household interviews and around 6,200 physical surveys. Survey results from adjacent years are normally amalgamated when a survey dataset is released to the research community, so that these then represent a discrete two-year period, including around 12,400 physical surveys.
10.4 Closing remarks: decarbonisation scenarios and emerging trends
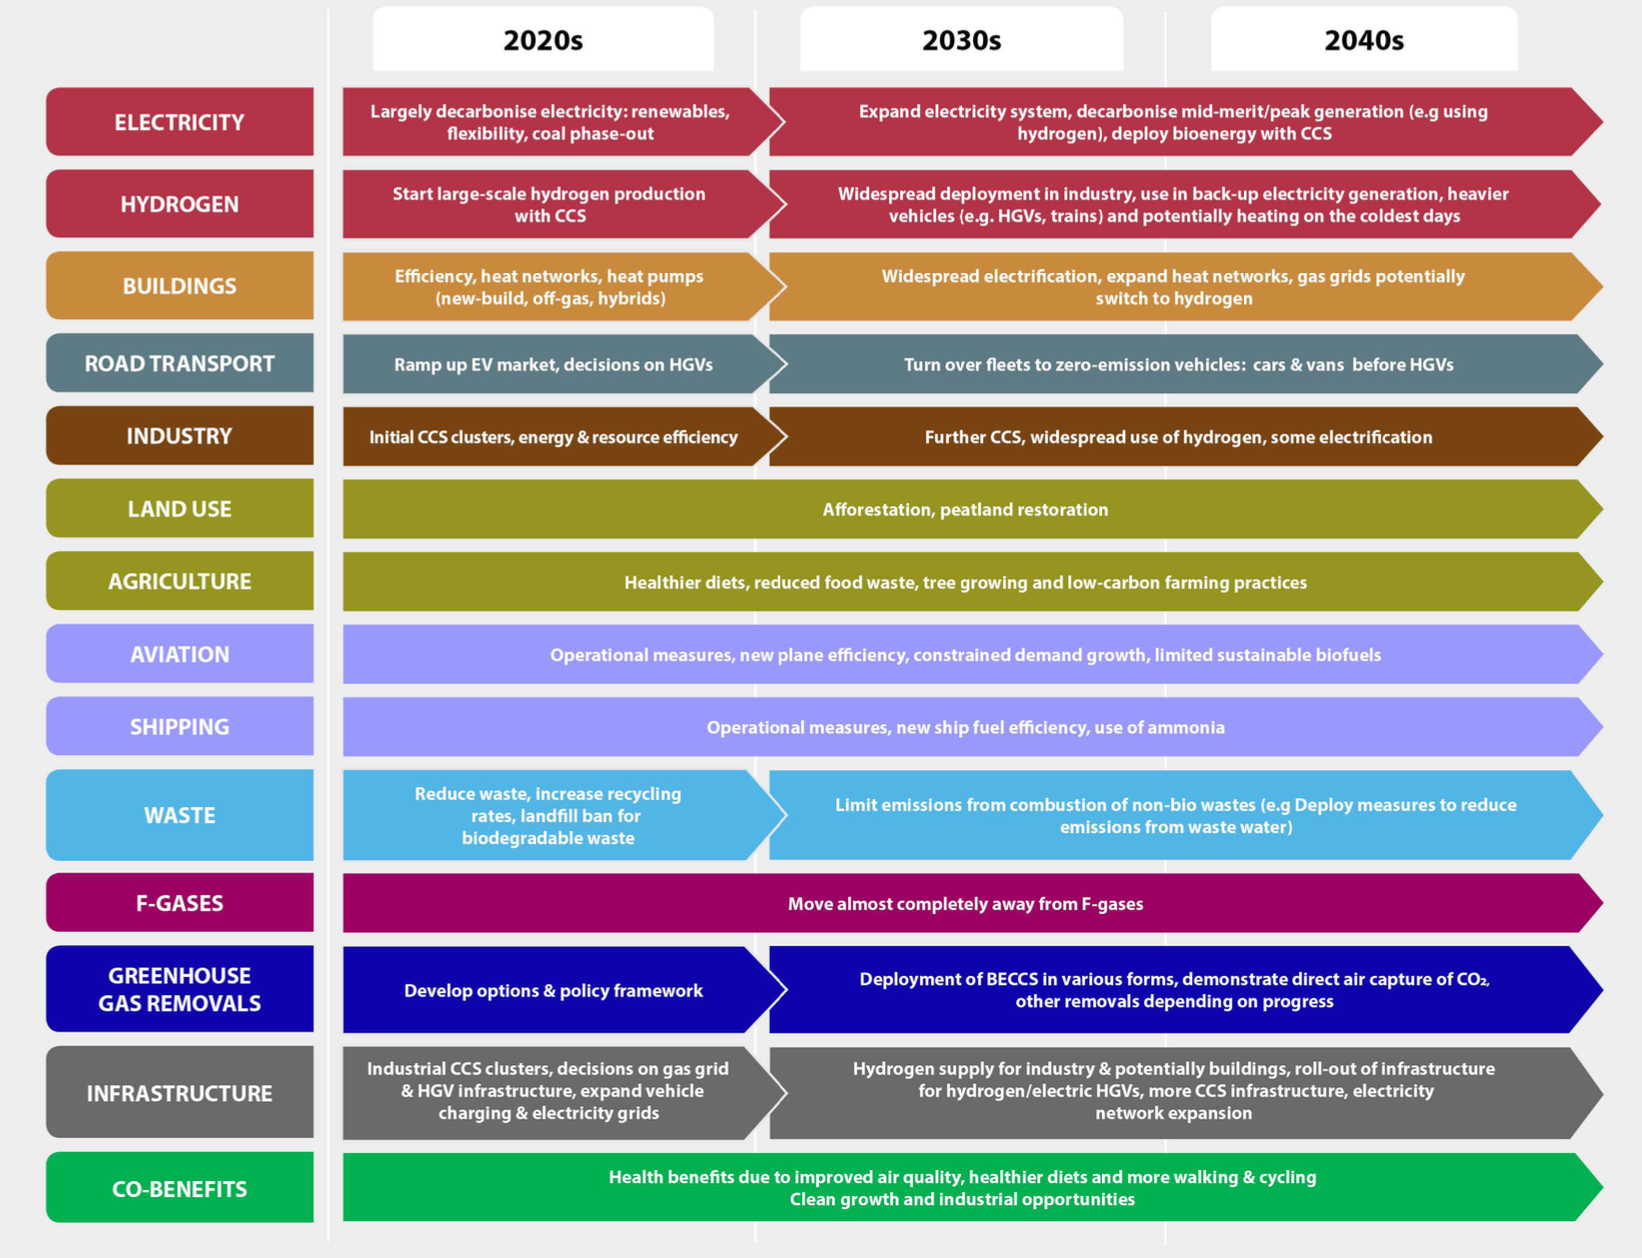
The UK Climate Change Committee (CCC) advises the UK government on strategies by which its commitment to achieve Carbon neutrality by 2050 may be achieved. In their recent report, they recommend the scenarios summarised in the figure below. These recommendations include:
- Resource and energy efficiency: reducing the demand for applied energy across the economy, to also reduce demands for low Carbon power, Hydrogen and Carbon Capture and Storage (CCS)[3]. This is thought to be more cost-effective than supply-side (e.g. renewable and nuclear energy) strategies.
- Societal choices: promoting reductions in travel, particularly long-haul flights, as well as dietary changes, to reduce the consumption of red meats and dairy products, which are energy-intensive to produce.
- Electrification: particularly of vehicles for the transport of goods and people and of space heating and hot water production (as mentioned in the previous section). This should be complemented by large-scale investments in renewables, especially offshore wind, most likely also complemented with nuclear energy.
- Hydrogen: this is thought to be a promising avenue to service energy-dense processes, including industrial processes, long-distance heavy goods vehicles and shipping as well as for heating (direct combustion) and electricity (using fuel cells) during periods of peak demand.
- CCS: In addition to capturing Carbon arising from the combustion of fossil fuels at conventional power stations as well as high-temperature industrial processes, mentioned above, capturing the emissions arising from the combustion of biofuels offers the prospect of sequestering Carbon without its subsequent release.
- Land use: promoting land uses that enhance the sequestration of CO2, primarily through forestry and biomass production, as well as the production of low Carbon foods, and peatland restoration.
In addition to these scenarios, there are some interesting related trends that are already beginning to emerge:
- Autonomous e-vehicles: the technology underpinning driverless autonomous vehicles, including route planning, sensing, data processing, risk detection and avoidance, is now approaching maturity, with large numbers of experiments already having been successfully completed. The city of Glasgow is currently (as of June 2023) conducting its first experiments with driverless buses and the introduction of driverless cars seems likely within this decade (the 2020s). This has the potential to be truly transformative, not only in terms of the efficiency of journeys (owing to Vehicle to Vehicle (V2V) and Vehicle to Infrastructure (V2I) communication), but also due to ownership models. This may involve a shift away from individual ownership of a vehicle, to the purchase of transport services using Uber-style platforms, with the vehicle driving itself to your origin and your destination on demand. Indeed, there may also be the option of more affordable journeys by sharing the vehicle cabin with other travellers to destinations that collectively make for an efficient route.
- Leasing not owning: In a similar way, we may see a move away from the ownership of electrical appliances, where manufacturers currently have a vested interest in rapid technology development, techno-fashion and in-built obsolescence, encouraging rapid replacement and disposal of electrical devices. If instead these devices are leased, the manufacturers would have a vested interest in maintaining their longevity, so reduce the nett consumption of materials, with corresponding energy and Carbon benefits.
- Distributed storage: In addition to the batteries integrated with EVs, we also have batteries in our laptops, tablets, smartphones etc. In principle, these too could be integrated with Demand Response algorithms, to optimise the storage of renewable electrical energy and its subsequent exchange between electrical devices to minimise the demand for energy from the national grid.
- District heating and synergetic couplings: At present, district heating networks tend to be based on relatively high flow and return temperatures (we call these high exergy[4] systems). As buildings become better insulated and heat pumps become more commonplace, then district heating systems may employ lower flow and return temperatures, lowering their exergy. This in turn may enhance the potential to utilise waste heat from industrial processes in the urban realm, as well as to utilise energy from waste through anaerobic digestion as a thermal top-up. This has parallels with the symbiosis project in Kalundbord (Denmark) and the developments at Bo01 in Malmö and at Hammarby Sjöstad that employed principles of industrial ecology that were inspired by it.
- Smarter systems: implicit in the above discussion is the assumption that electrical appliances, vehicles, buildings and infrastructure are likely to become smarter, to communicate with one another, to anticipate inhabitants’ needs and to respond to these needs whilst achieving goals that may include environmental sustainability, health and wellbeing. We are already witnessing a proliferation of artificial intelligence (AI), but this needs to be met with deeper consideration of the ethical use and oversight of this technology, to ensure the wellbeing of all, including safety and privacy.
The increasingly ubiquitous availability of physical and social data provides the potential, subject to appropriate ethical safeguards, of high resolution and high quality data with which to calibrate and validate increasingly sophisticated and integrated computer models with which to test scenarios to improve the environmental functioning of increasingly complex and interconnected systems; maximising environmental sustainability and quality of life through the planning, design and subsequent operation of these systems. We are likely to bear witness to an unprecedented pace of socio-technical innovation in the decades to come; an exciting prospect indeed!
References
Chandler, T.J. (1965). The climate of London. Hutchinson: London, 292 pp
Climate Change Committee (2019), Net Zero: The UK’s contribution to stopping global warming, May 2019.
Graves, H., Watkins, R., Westbury, P. and Littlefair, P. (2001) Cooling Building in London:
Overcoming the Heat Island, BRE Report BR 431, CRC Ltd, London.
Hodgkin, R., Sasse, T. (2022), Tackling the UK’s energy efficiency problem: What the Truss government should learn from other countries, Institute for Government, September 2022.
Howard, L. (1833), The climate of London deduced from meteorological observations made in the metropolis, London: Harvey and Darton, 1833.
Kumar P., Sharma, A. (2020), Study on importance, procedure, and scope of outdoor thermal comfort – A review, Sustainable Cities and Society, Volume 61, October 2020, 102297.
Lai, D., Lian, Z., Liu, W., Guo, C., Liu, W., Liu, K., Chen, Q. (2020), A comprehensive review of thermal comfort studies in urban open spaces, Science of the Total Environment 742 (2020) 140092.
Office for National Statistics (2021), Excess mortality during heat-periods: 1 June to 31 August 2022, ONS 2021.
Robinson, D., Stone, A. (2004), Solar radiation modelling in the urban context, Solar Energy, (77)3 2004, p295-309.
Robinson, D. (2011), Computer modelling for sustainable urban design: physical principles, methods and their applications, Taylor & Francis: London, 2011 (ISBN: 9781844076796).
Robinson, D (2019), Integrated resource flow modelling of the urban built environment, In: Building Performance Simulation for Design and Operation, Routledge, p659-695.
Robinson, D., Tilley, H., Price, J., Lloyd, A. (2023)Housing stock energy modelling: Towards a model for Wales, Welsh Centre for Public Policy, January 2023 (https://www.wcpp.org.uk/publication/housing-stock-energy-modelling-towards-a-model-for-wales/)
Sousa, G., Mirzaei, P., Jones, B., Robinson, D. (2017) A review and critique of UK housing stock energy models, modelling approaches, and data sources, Energy and Buildings, 151: 66-80.
Sousa, G., Jones, B., Mirzaei, P., Robinson, D. (2018), An open-source simulation platform to support the formulation of housing stock decarbonisation strategies, Energy and Buildings, Volume 172: p459-477.
United Nations. 2014 World urbanization prospects. The 2014 Revision. New York, NY: United Nations.
- This can be a helpful distinction, because we may assume that far-field obstructions are sufficiently removed from a building of interest that the interactions between them are essentially one-directional: the hill or mountain influences our building, but the influence of our building on the irradiation incident on the hill or mountain or so small that it can be ignored. This tends not to be the case for near-field obstructions, in which the bi-directional exchanges of energy do normally need to be explicitly accounted for. ↵
- for this was also discussed briefly in the Daylighting in Architecture Chapter ↵
- CCS involves the capture of CO2 emissions from industrial processes, such as steel and cement production, or from the burning of fossil fuels in power generation. This carbon is then transported from where it was produced, via ship or in a pipeline, and stored deep underground in geological formations. ↵
- In thermodynamics, the exergy of a system is the maximum useful work that is possible during a process that brings the system into equilibrium with a heat reservoir (this may be the surrounding environment), reaching maximum entropy (a thermodynamic measure of disorder). Exergy is the energy that is available to be used. After the system and surroundings reach equilibrium, the exergy is zero. ↵
