
12 Tables
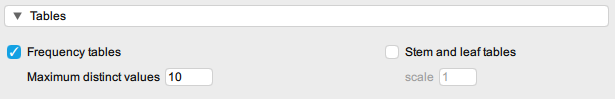
The fourth and final expandable menu in ‘Descriptive Statistics’ is called Tables.
This menu has two options: Frequency tables and Stem and leaf tables. You are only likely to use the ‘Frequency tables’ option as it allows you to obtain information about the frequencies for categorical variables which is usually the first step in a chi-squared analysis (see Section 17).
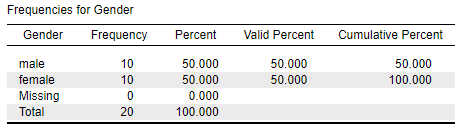
The most important information in the Frequency Table output is:
- Total number of people in your sample. In statistics, we denote the total sample size with the capital letter N in italics.
- The Frequency (i.e., number) of people in each group of the sample. This is only really of interest when you have a categorical variable.
