
14 Independent t-test and Mann-Whitney U
Independent t-test
The independent t-test is used for analyses with a continuous dependent variable and a categorical independent variable but only when a between-participants (independent measures) design is used.
Note: The t-test can only be used to compare the differences in the means of two groups. For analyses with 3 groups or more, you can use another parametric test such as a one-way ANOVA (not covered in this guide).
How do I do that?
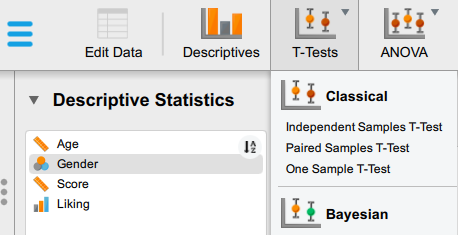
1. In the ‘T-Test’ menu select Independent Samples T-Test from the ‘Classical’ list.
2. A new window will then open, like so:
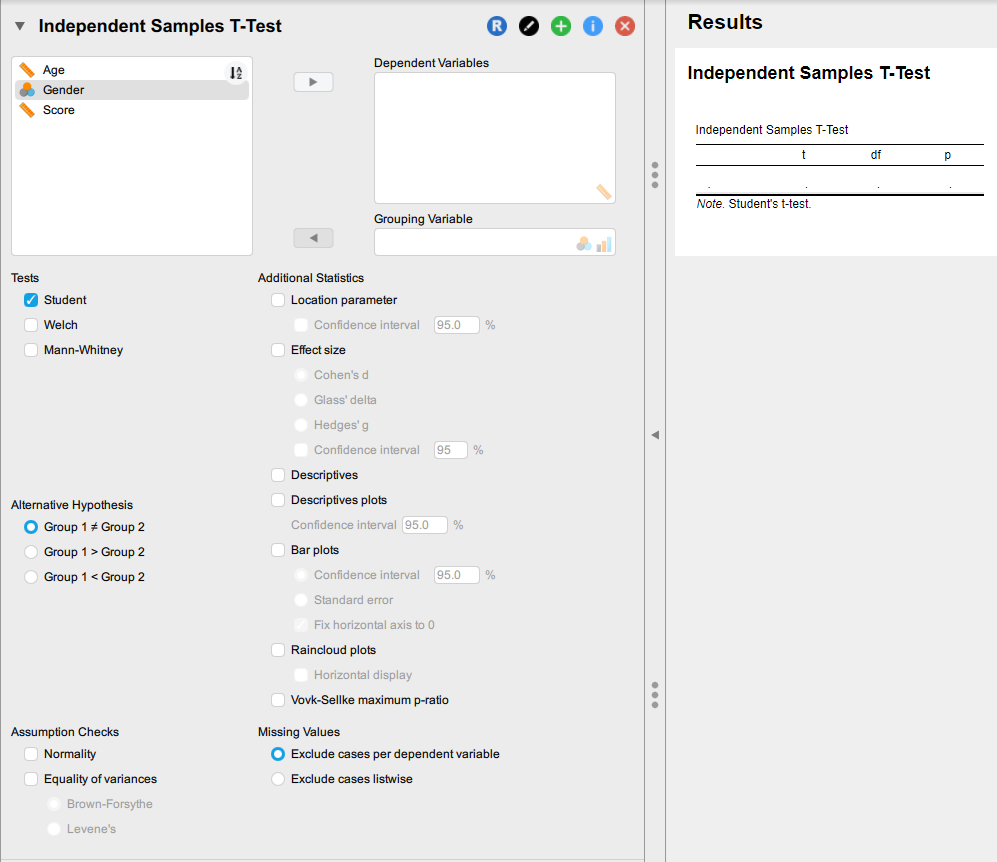
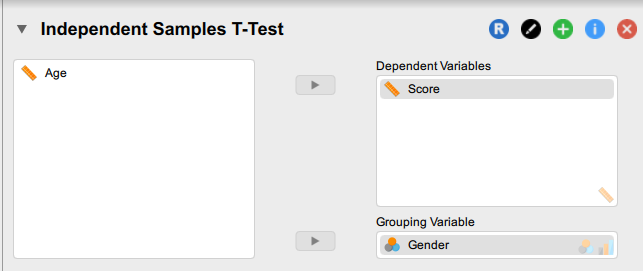
3. Move your continuous dependent variable (indicated by a ruler symbol) into the Dependent Variables box and your categorical independent variable (indicated by a Venn diagram symbol) into the Grouping Variable box.
4. There are many options in the expandable menus for this type of analysis which can initially be overwhelming. However, it is unlikely that you will need all of them. Here are some of the t-test options which you are likely to use:
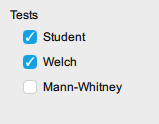
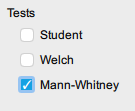
Tests. The ‘Student’ test is the default, but you can also select the ‘Welch’ test which is reported if the assumption of equality of variance has been violated. If you have non-parametric data, you need to select the ‘Mann-Whitney’ (see next section).
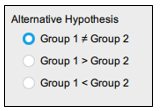
Alternative Hypothesis. The default is the hypothesis that Group 1 ≠ Group 2. This is the non-directional hypothesis and for most cases, you will not change this. You can see that there are two options for the directional hypotheses.
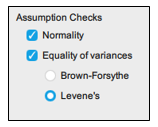
Assumption Checks. These help you decide whether any of the assumptions for conducting an independent t-test have been violated; normality of distribution and equality of variances. For equality of variances select ‘Levene’s’.
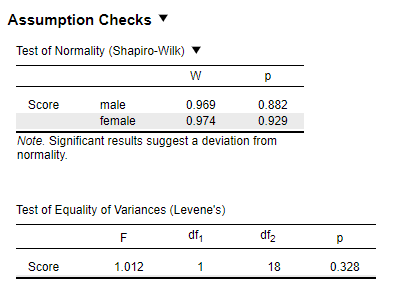
The output for the Assumption Checks looks like this:
-
-
-
- The Test of Normality statistic is Shapiro Wilk (W). In this output, you can see that neither of the groups significantly differs from a ‘normal’ distribution.
- The Equality of Variances statistic is Levene’s (F). In this output,t you can see that there is no significant difference in the group variances.
-
-
Additional Statistics. These provide you with additional information about your results. Unless instructed otherwise, it’s usually a good idea to generate the following additional statistics: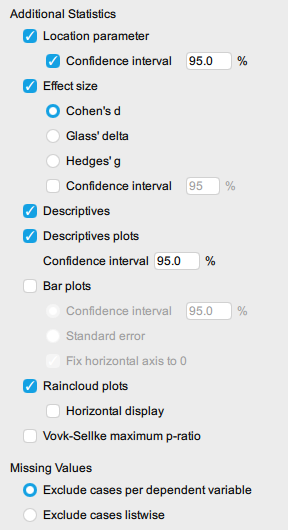
-
-
-
- Select Location parameter and Confidence Interval.
- Selecting Effect Size will select Cohen’s d as the default. Glass’ delta or Hedges’ g are the other options that you can ignore for now.
- Selecting Descriptives and Descriptive plots will give you some basic descriptives and an error bar plot to help visualise the data.
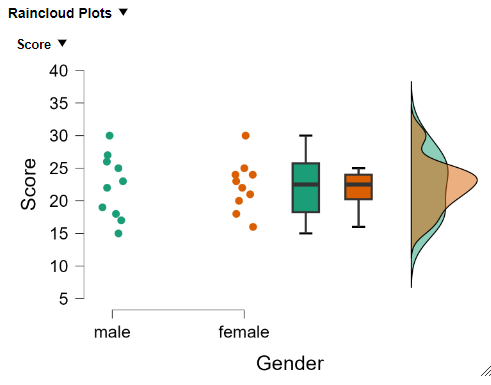
- Selecting Raincloud plots gives you a rather fantastic set of plots that helps visualises the data in scatterplots, boxplots and overlayed histograms.
-
-
Mann-Whitney U Test
The Mann-Whitney U is a non-parametric alternative to the independent t-test. It is primarily used when your data violates the assumption of normal distribution (i.e., if you have a significant Shapiro-Wilk test result).
How do I do that?
1. Follow Steps 1-3 from the independent t-test section and then select the Mann-Whitney U option in the ‘Tests’ menu.
2. As with the independent t-test, the default for Alternative Hypotheses is Group 1 ≠ Group 2. This is the non-directional hypothesis and for most cases, you will not need to change this.
3. Under the Analysis options, you will only need to select Effect Size and leave the default as Cohen’s d. In the output table the effect size will be given by the Rank-Biserial Correlation. This can be interpreted in the same way as Pearson’s r.
4. You may also want to select ‘Raincloud plots’ as this helps to visualise the data.
