
3 Creating Data Files in JASP
Opening an Existing JASP Data File
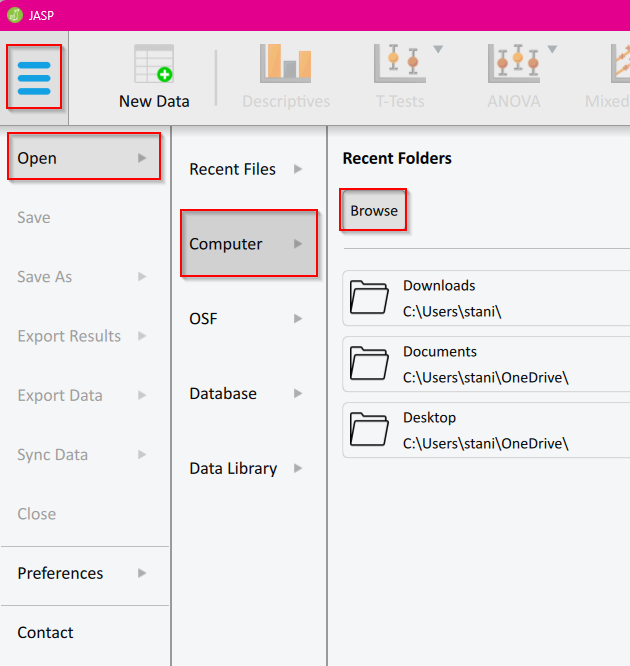
1. Click on the collapsed menu icon. A side menu should appear on the left.
2. Select Open > Computer > Browse then find the folder where the JASP data file is saved.
3. Click Open.
Alternatively, you can directly open a JASP data file from the computer folder in which it is saved.
Creating a New JASP Data File
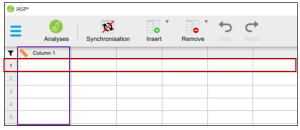
If you select the ‘New Data’ button, you will notice that some of the menu items in the toolbar at the top will change. You will learn about these later.
Each row contains information for one participant. So, if you have multiple pieces of data about one participant (e.g., age, gender, and height) they will need to be inserted in the same row.
Each column represents one variable (e.g., age).
You will need to enter the relevant information for each of your variables (i.e., column) per each participant (i.e., row).
How do I do that?
Double-click on the header of the column you wish to edit (e.g., Column 1). This will open a new section above your data which contains the information for that variable.
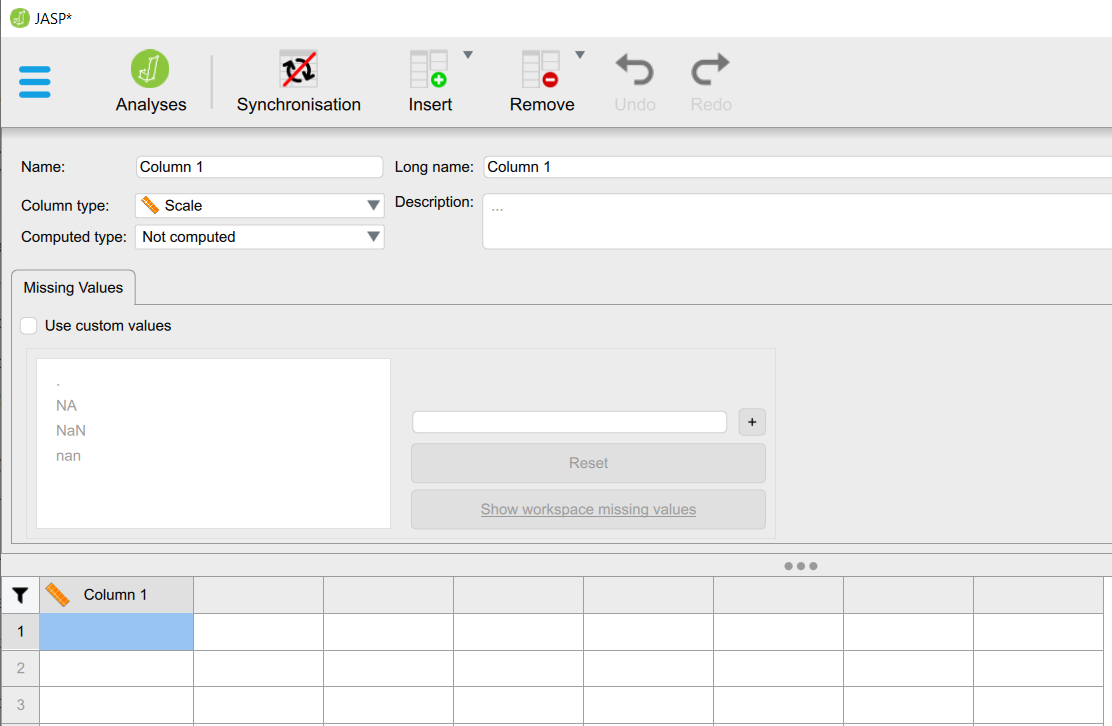
When you are setting up a new variable, the most important information you need to enter is:
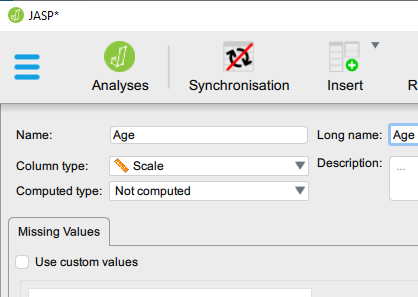
1. Name: Enter the name of your variable (e.g., Age). Try to keep this name relatively short.
2. Long Name: If your variable is slightly more complex (e.g., Age of participants at the start of the study) then you can provide that information in this box.
3. Description: This box allows you to give even more information about the variable. This can be useful for data sets with a large number of variables.
4. Column type: Select the type of variable. This will affect the analysis that JASP will allow you to conduct, as some analyses are specific to the variable type.
-
-
- Scale (for continuous variables; e.g., age)
- Nominal (for categorical variables; e.g., gender)
- Ordinal(for variables that use a scale; e.g., Likert scale)
-
5. Computed type: This allows you to calculate new variables (e.g., a sum of other variables).
Entering Categorical (Scale) Variables
How do I do that?
1. Enter the name of the variable and select ‘Scale’ as the Column Type.
2. Enter your data by clicking into the empty cell for each row/column.
Entering Categorical (Nominal) Variables – Assigning Labels to Groups
For categorical data, you will need to specify which values in your dataset relate to which group or category (e.g., for Gender, 1 = male and 2 = female). You can have as many categories as you need. For example, for Gender you may also have 3 = non-binary and 4 = other.
How do I do that?
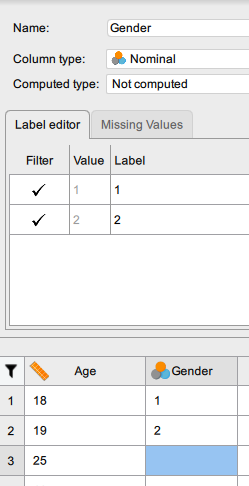
1. Enter the variable name (e.g., Gender) and select ‘Nominal’ as the column type.
2. Enter the numerical values for the category or group that each participant belongs to in the variable column. In the example, we have 1 = male and 2 = female (see A). This information will now appear under the ‘Label editor’.
A
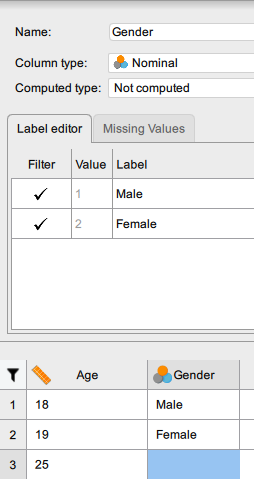
3. Once you have entered the data for your participants go to the ‘Label editor’ and double-click on the ‘Label’ next to the ‘Value’ to change the number to a more meaningful name for your category or group (see B). This change will be reflected in the variable column where you should now be able to see the label.
B
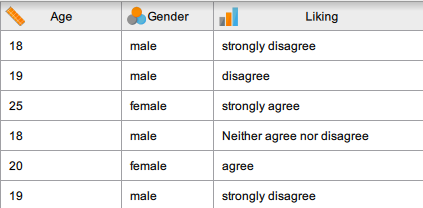
Note: JASP will let you use ‘string’ variables (i.e., words). However, you need to enter the words in exactly the same way otherwise JASP will think you have additional categories. If you choose to enter the data in this way, check the ‘Label editor’ to make sure you have the correct number of categories.
Entering Ranked (Ordinal) Variables
In the same way that you assign numerical values to categorical variables, you will also have numerical values for ranked variables (e.g., liking ratings on a questionnaire). Usually, ordinal variables will have more than two values.
How do I do that?
1. Enter the variable name (e.g., Liking) and enter ‘Ordinal’ as the column type.
2. Enter the numerical value for each of your values (e.g., 1 = strongly disagree, 2 = disagree, etc.).
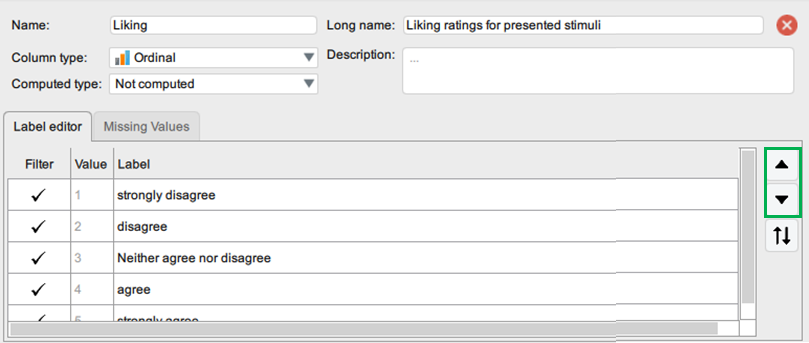
3. Once you have entered these values for your participants go to the ‘Label editor’ and double-click on the ‘Label’ next to the ‘Value’ to change the number to the label for each of the ranked variables. This change will be reflected in the variable column where you should now be able to see the label.
4. It might be the case that when you are entering your data the values are not in numerical order. In the ‘Label editor’ you can use the arrows on the right-hand side of the box to move the labels so that they are in a logical order (e.g., 1, 2, 3, 4, etc.).
Saving JASP Data Files
The best place to save your work when you are working from a university computer is a dedicated drive, folder, or cloud storage which you can access from any managed university device. We strongly recommend saving your work periodically to avoid losing progress.
How do I do that?
1. Click on the collapsed menu icon. A side menu should appear on the left. Select ‘Save As’.
2. Once provided with the option, click on the little arrow at the top of the Save Menu. A drop-down menu will appear listing all the possible places on your computer where you could save your file.
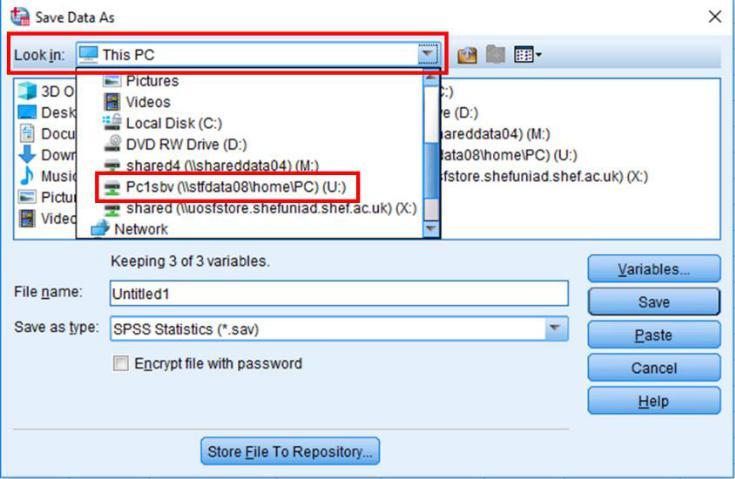
3. In the list of drives find the one which has (U:) at the end or you know is a safe place to store your work.
4. Click on your selected drive. This should then bring up the folders and files currently listed in that drive.
5. Give your file an appropriate file name and click Save.
Note: If you’re not working on a university computer, we recommend that you create a dedicated folder on your own device to save your JASP files. There is nothing worse than losing your data file or analysis!
