8 Computing New Variables
There can be various reasons as to why you may want to compute (i.e., create) a new variable. JASP provides you with a lot of options that you may not ever need to use.
This section provides you with an overview of the basic aspects of this function, but you may need to experiment further should you need to use this option.
Example Use Cases
– Calculating a total score based on item scores from a questionnaire.
– Creating a categorical variable based on a continuous data set (e.g., identify young/old participants based on age below/above 60 years).
– Calculating difference scores between two variables (e.g., score before – score after treatment).
How do I do that?
Using the ‘Computed’ function within the variable box allows you to create a new variable. In most cases, you will base your new variable on certain calculations you want to do with existing variables.
There are two options for computing a new variable:
1. Computed with drag-and-drop
2. Computed with R code
Here is a quick overview of the ‘Computed’ function:
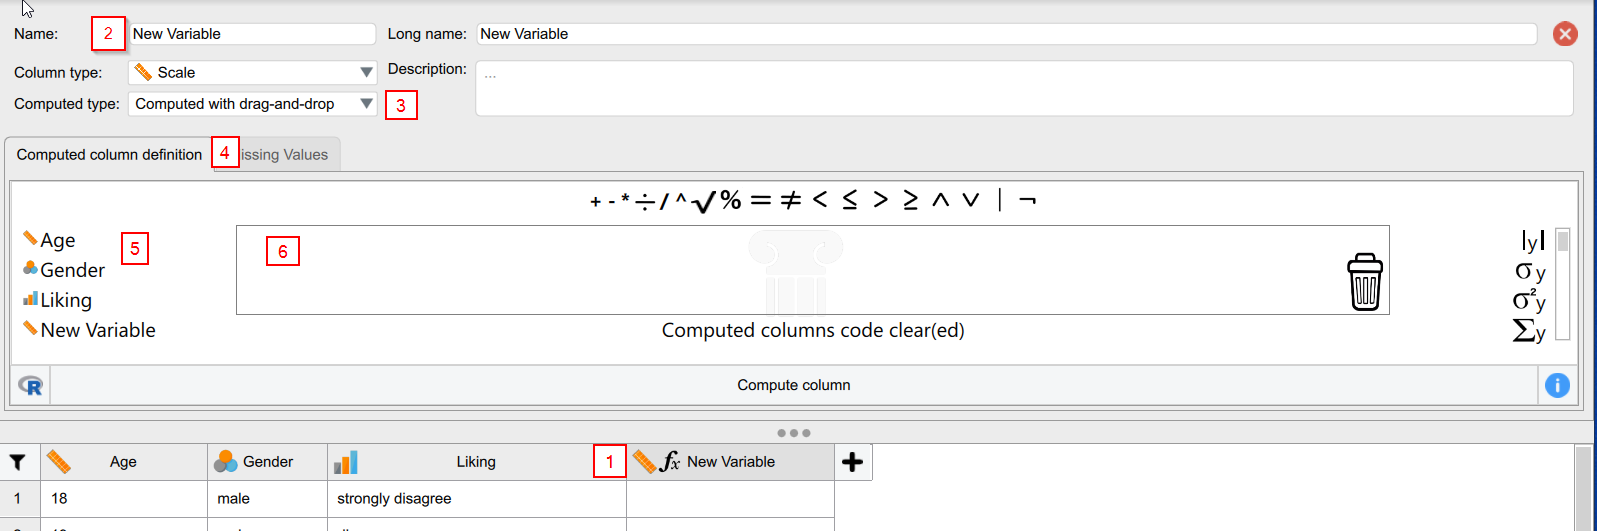
1. Double-click on the first empty column heading or click on the ‘+’ button.
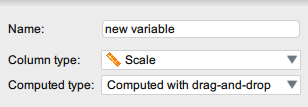
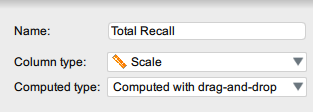
2. Give the new variable a name.
3. Select ‘Computed with drag-and-drop’ from the ‘Computed type’ drop-down menu.
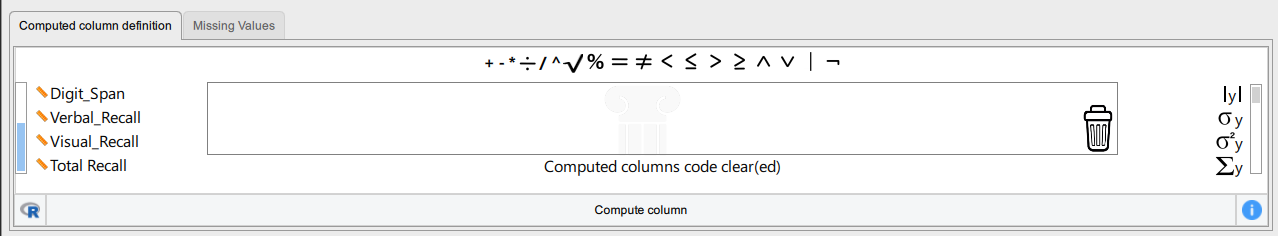
4. A new tab, ‘Computed column definition’, will now appear.
5. On the left-hand side of the box, you can see a list of all the variables in the dataset.
6. The central box is where you enter your calculations.
Computing the Sum of Multiple Variables/Columns
If you have a questionnaire or other measure that consists of multiple items or scores you might want to calculate a total or average score. To do this, you would use the Computed with drag-and-drop option.
Example 1
How do I do that?
1. Create a new variable column, either by double-clicking on an empty column, or by clicking the ‘+’ button.
2. Select Computed with drag-and-drop.
3. In the ‘Computed column definition’ tab, find the variables you want to sum. You may need to use the scroll bar on the left of the variable list to find your chosen variables.
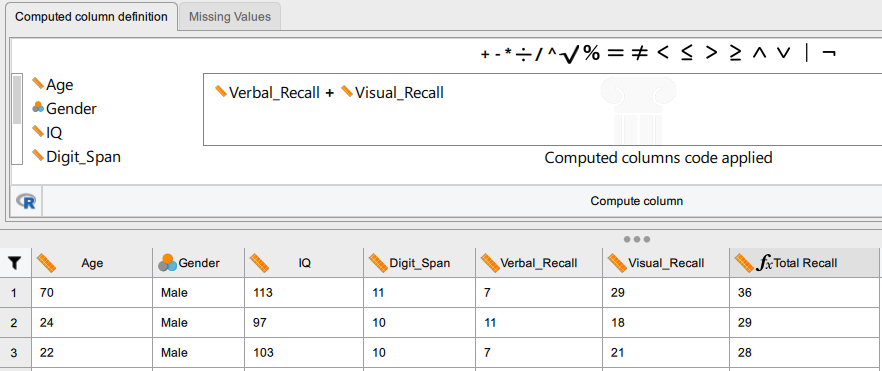
4. Select each variable by clicking on it. Use the mathematical signs above the computing box to create your formula (e.g., Variable 1 + Variable 2).
5. Click on Compute column.
6. Your newly created column (‘Total Recall’) will now be populated with the sum of your chosen variables (‘Visual Recall’ + ‘Verbal Recall), like so:
Transforming Continuous Variables into Categorical Variables
Example 2
How do I do that?
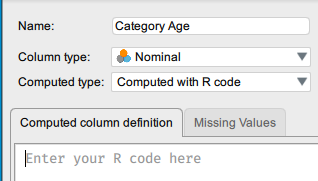
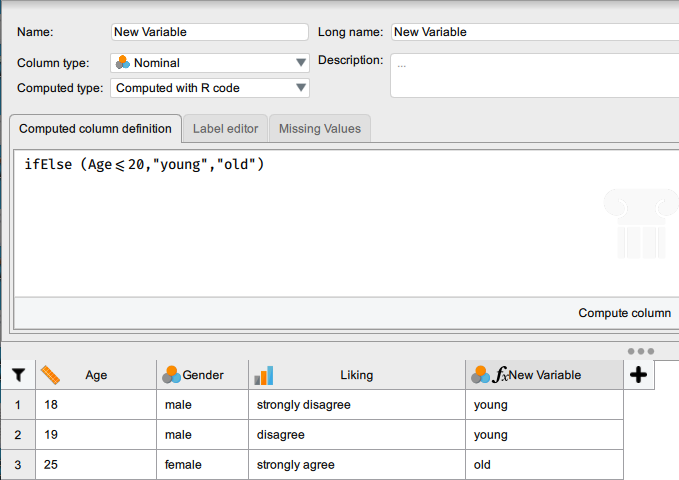
1. Give your new variable a name and change the ‘Column type’ to ‘Nominal’.
2. For this calculation, you will need to use the Computed with R code option. Don’t be frightened by the prospect of “coding”, this is no more complex than using formulas in Excel (we promise).
3. Next you need to type a command into the ‘Computed column definition’ box.
-
- You are going to use the command ifElse. This function tells JASP to run one block of code if a statement is TRUE, and a different block of code if it is FALSE. In this example, you would type the following in the box: IfElse (Age <= 20, “young”, “old”)
- What this command translates to is: if the value in the ‘Age’ column is equal to or less than 20, the corresponding value for the new variable column will have the label ‘young’, otherwise the value will have the label ‘old’.
4. Click on Compute column.
-
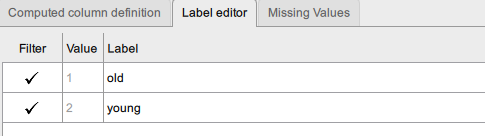
- You can check if you have done it correctly by clicking on the new variable’s Label editor tab where you should see that numerical value have been allocated to each label: 1 = old, 2 = young.