17 Chi-squared Test
The Chi-squared test is used only with categorical variables. This test assesses whether the categorical variables are related and is used to make inferences about the likelihood that there is a certain pattern within the data (e.g., is it more likely that women who live alone have cats when compared to men who live alone).
Creating Frequency Tables
If you have the raw data (with columns for each variable), you will need to get the frequencies (count) for each combination of the variables first. To do this, you will need to generate a Frequency Table for your variables.
Note: Your data may already be in the correct format so you may be able to skip the steps above and go straight to conducting the test. You can also perform these steps in Microsoft Excel.
How do I do that?
1. In the Descriptives menu move one variable to the ‘Variables’ box, and the other variable to the ‘Split’ box. Where you put each variable does not matter but it does determine how your frequency table looks. We recommend swapping the variables to see which table layout you prefer.
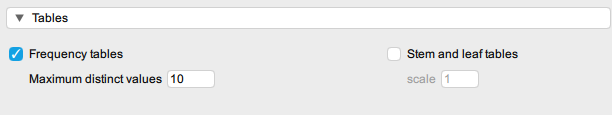
2. In the Tables menu, select ‘Frequency tables’.
-
-
- Doing so will give you the Frequency Table for your variables:
-
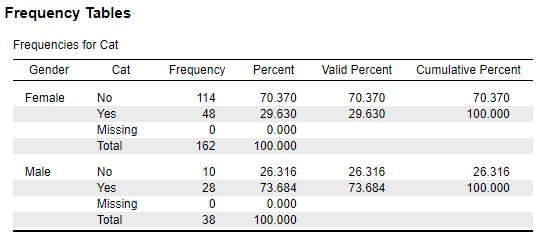
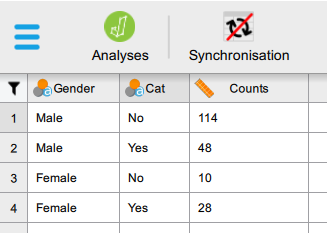
3. You need to create a new dataset using the frequency data, each row representing one combination of variables. You can obtain this information from your ‘Frequency Table’. It should look something like this:
Conducting a Chi-squared Test
Your data should now be in a form suitable for conducting the chi-squared test.
How do I do that?
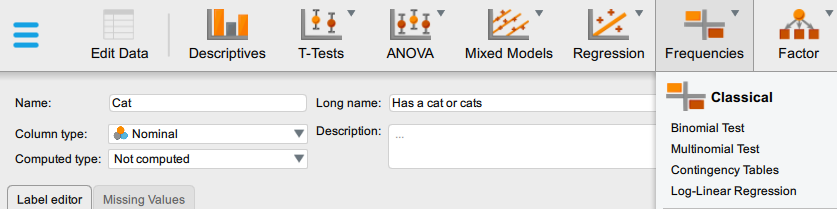
1. In the Frequencies menu select ‘Contingency Tables’ from the ‘Classical’ list.
A new window will open, like so:
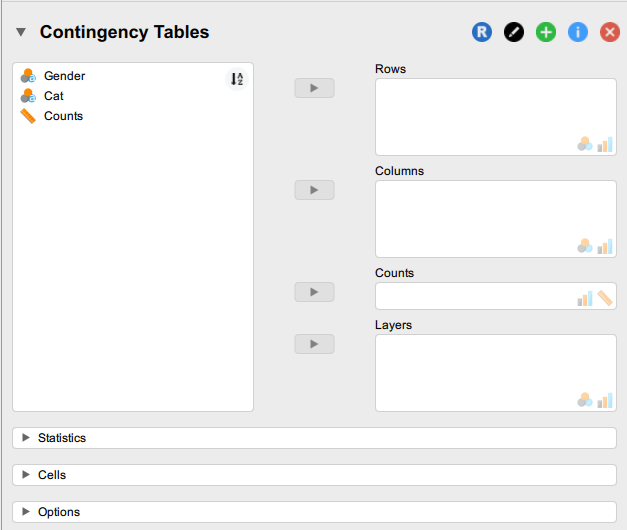
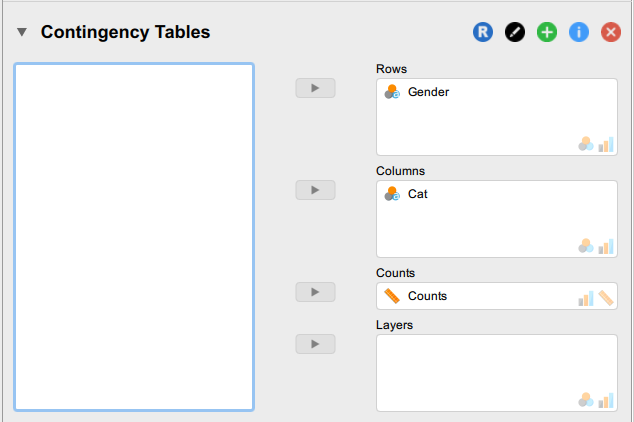
3. Move the Counts variable to the ‘Counts’ box. Next, move one of the variables of interest to the ‘Rows’ box and the other variable to the ‘Columns’ box. If you have more than two variables, then you can add extra variables to one of these boxes.
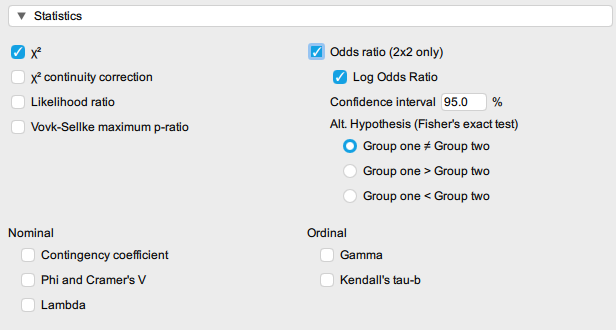
4. In the Statistics menu, select:
-
-
- χ2 (chi-squared), χ2 continuity correction, and Likelihood ratio. The last two are statistics with slight adjustments but in most cases, the statistics will actually be the same for all three options.
-
-
-
- Phi and Cramer’s V – Phi squared will give you a measure of shared variance and Cramer’s V is the measure of effect size for Chi-squared.
-
-
-
- Odds ratio – selecting this option will give you Fisher’s exact test which is a more accurate statistics with small sample sizes (<20) but this test only works for a 2×2 contingency table.
-
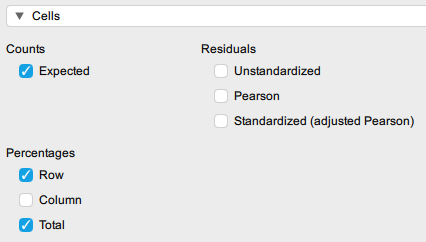
5. In the ‘Cells’ menu select ‘Expected’ under Counts, and ‘Row’ and ‘Total’ under Percentages. This will then give you all the outputs you need to interpret the Chi-squared analysis.